Set C Paper 4: Alternative to Practical Mock Exam
Question 1
[19 marks]A student investigated the effect of different concentrations of salt solution on a hollow plant stem.
They were provided with a 2% salt solution and distilled water. The student used these to make up different concentrations of salt solution.
Step 1 | Four test-tubes were labelled 1, 2, 3 and 4. |
Step 2 | The information in Table 1 was used to make up the four different salt solutions in the test-tubes. |
Table 1
Test-tube | Volume of 2% salt solution / cm3 | Volume of distilled water / cm3 | Final percentage concentration of salt solution |
1 | 0 | 20 | 0.0 |
2 | 5 | 15 |
|
3 | 10 | 10 | 1.0 |
4 | 20 | 0 | 2.0 |
(i)
Complete Table 1 by calculating the final percentage concentration of the salt solution in test-tube 2.
[1]
Step 3 | The contents of each test-tube were poured into four Petri dishes labelled 1, 2, 3 and 4. |
Step 4 | A hollow stem was cut into 12 rings using a sharp scalpel. Each stem ring was approximately 2mm long, as shown in Fig.1 |
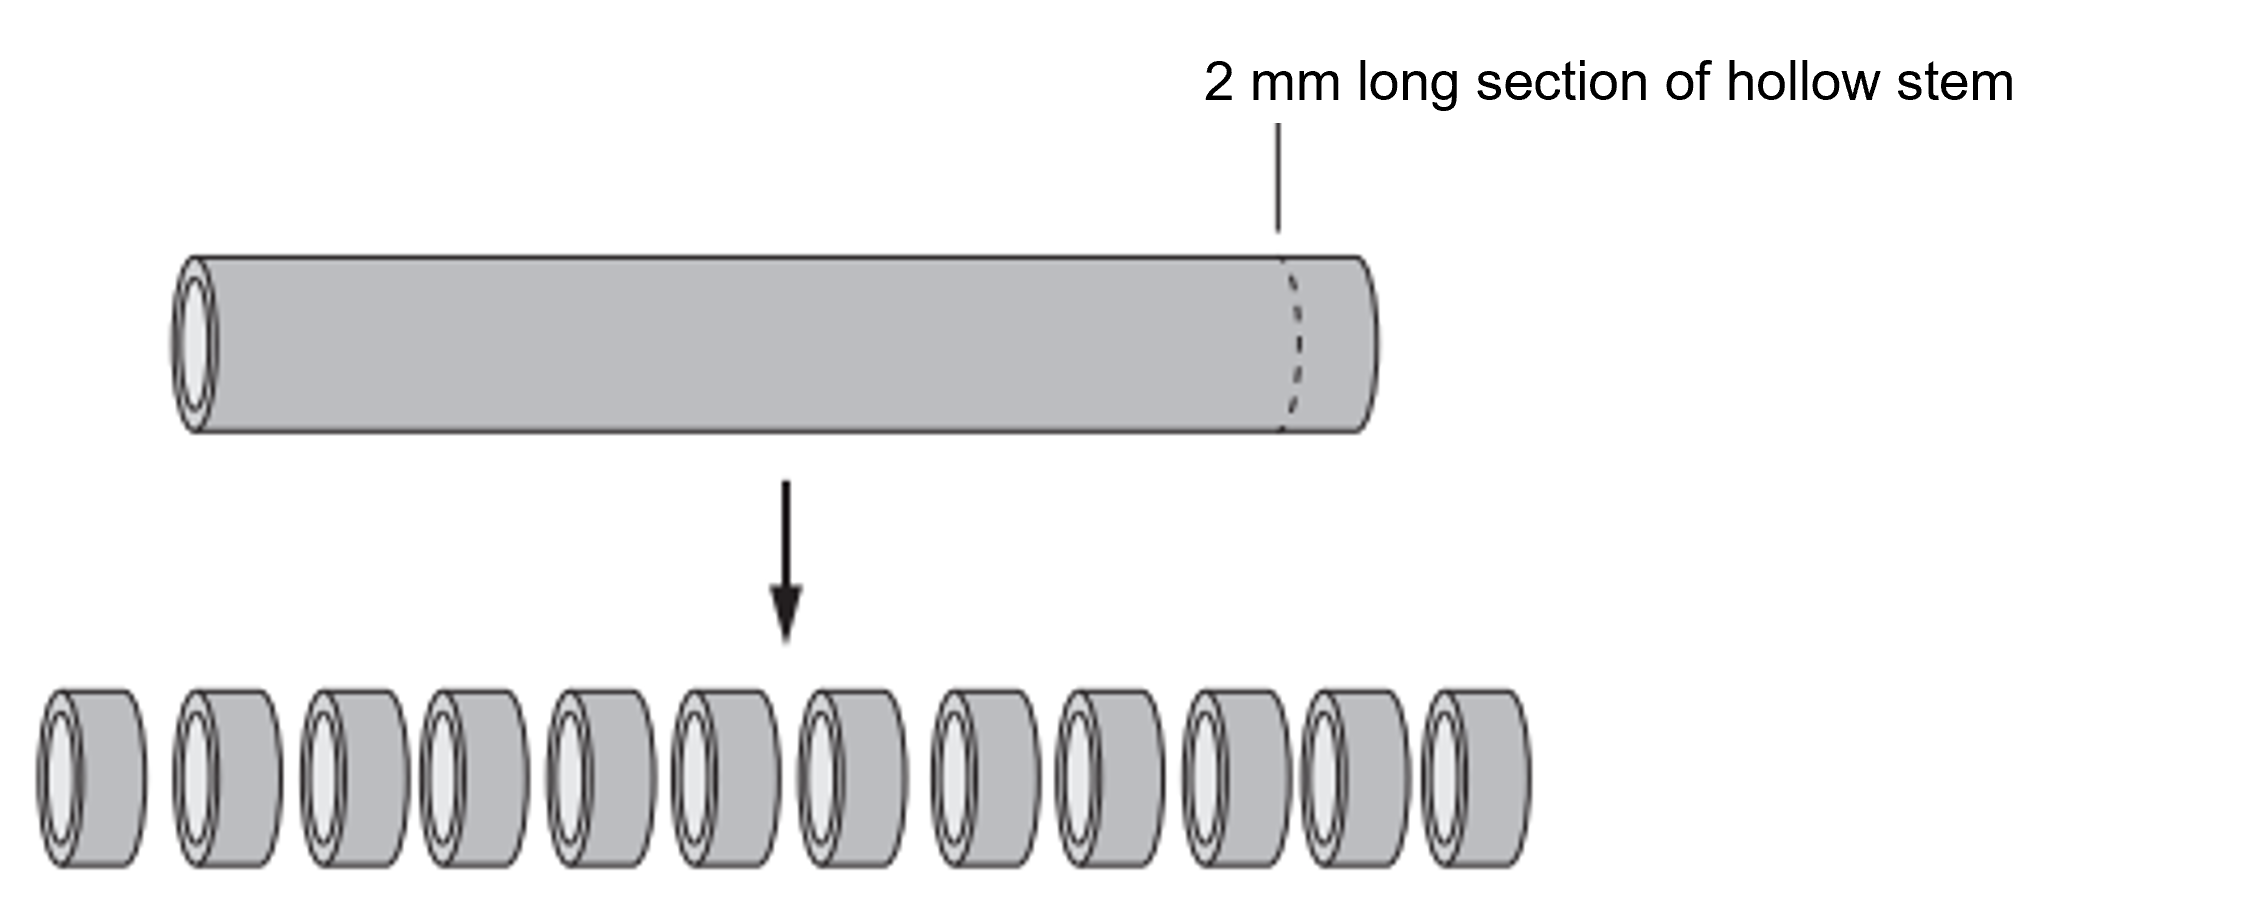
Fig. 1
Step 5 | Each stem ring was then cut open as shown in Fig. 2. |
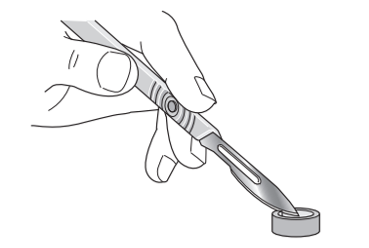
Fig. 2
Step 6 | Three cut stem rings were put into each of the different salt solutions in the labelled Petri dishes and left for 10 minutes. |
Fig. 3 shows the appearance of the cut stem rings after 10 minutes.
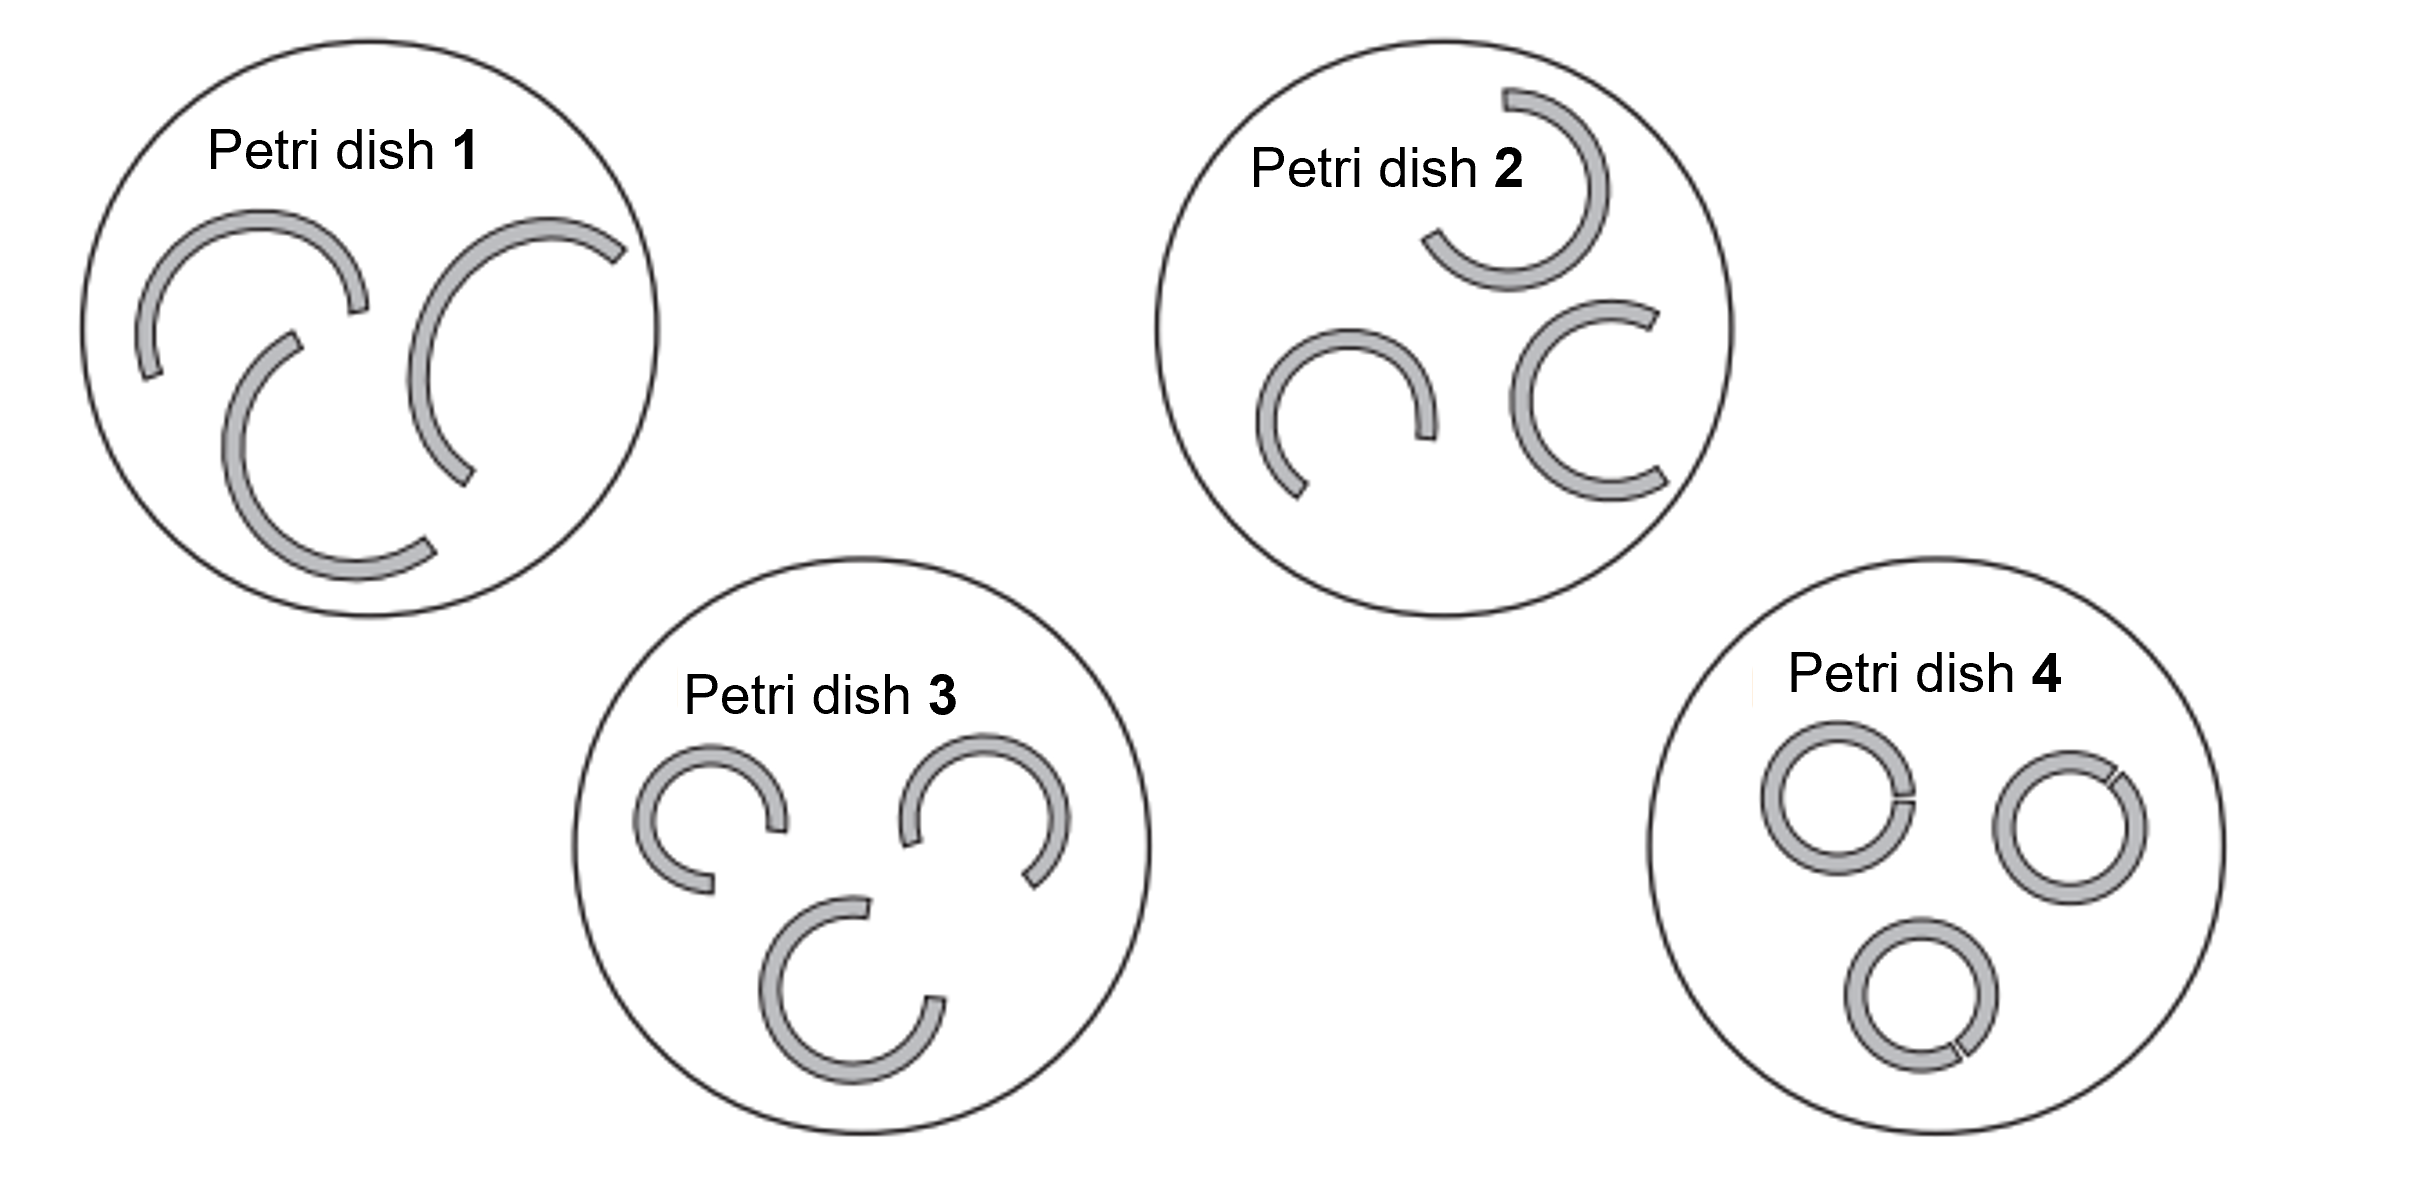
Fig. 3
Step 7 | The distance between the two cut ends of each stem ring can be measured, as shown in Fig. 4 |
In the example shown in Fig. 4 the distance is 12 mm.
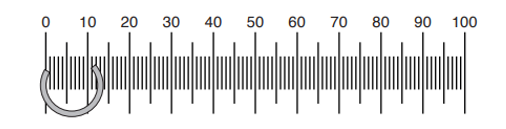
Fig. 4
The measurements of each stem ring were as follows:
Petri dish 1: 18 mm, 20 mm, 17 mm
Petri dish 2: 10 mm, 12 mm, 12 mm
Petri dish 3: 7 mm, 10 mm, 12 mm
Petri dish 4: 1 mm, 1 mm, 1 mm
(ii)
Prepare a table and record your measurements in your table.
Your table should show:
all of your results
a calculated average for each solution.
[4]
(iii)
Use Table 1 and your measurements to describe the results shown in Fig. 3
[1]