12 marks
Study Fig. 1.1, which shows information about birth rates and death rates in Mexico (an LIC) between 1900 and 2060 (estimated).
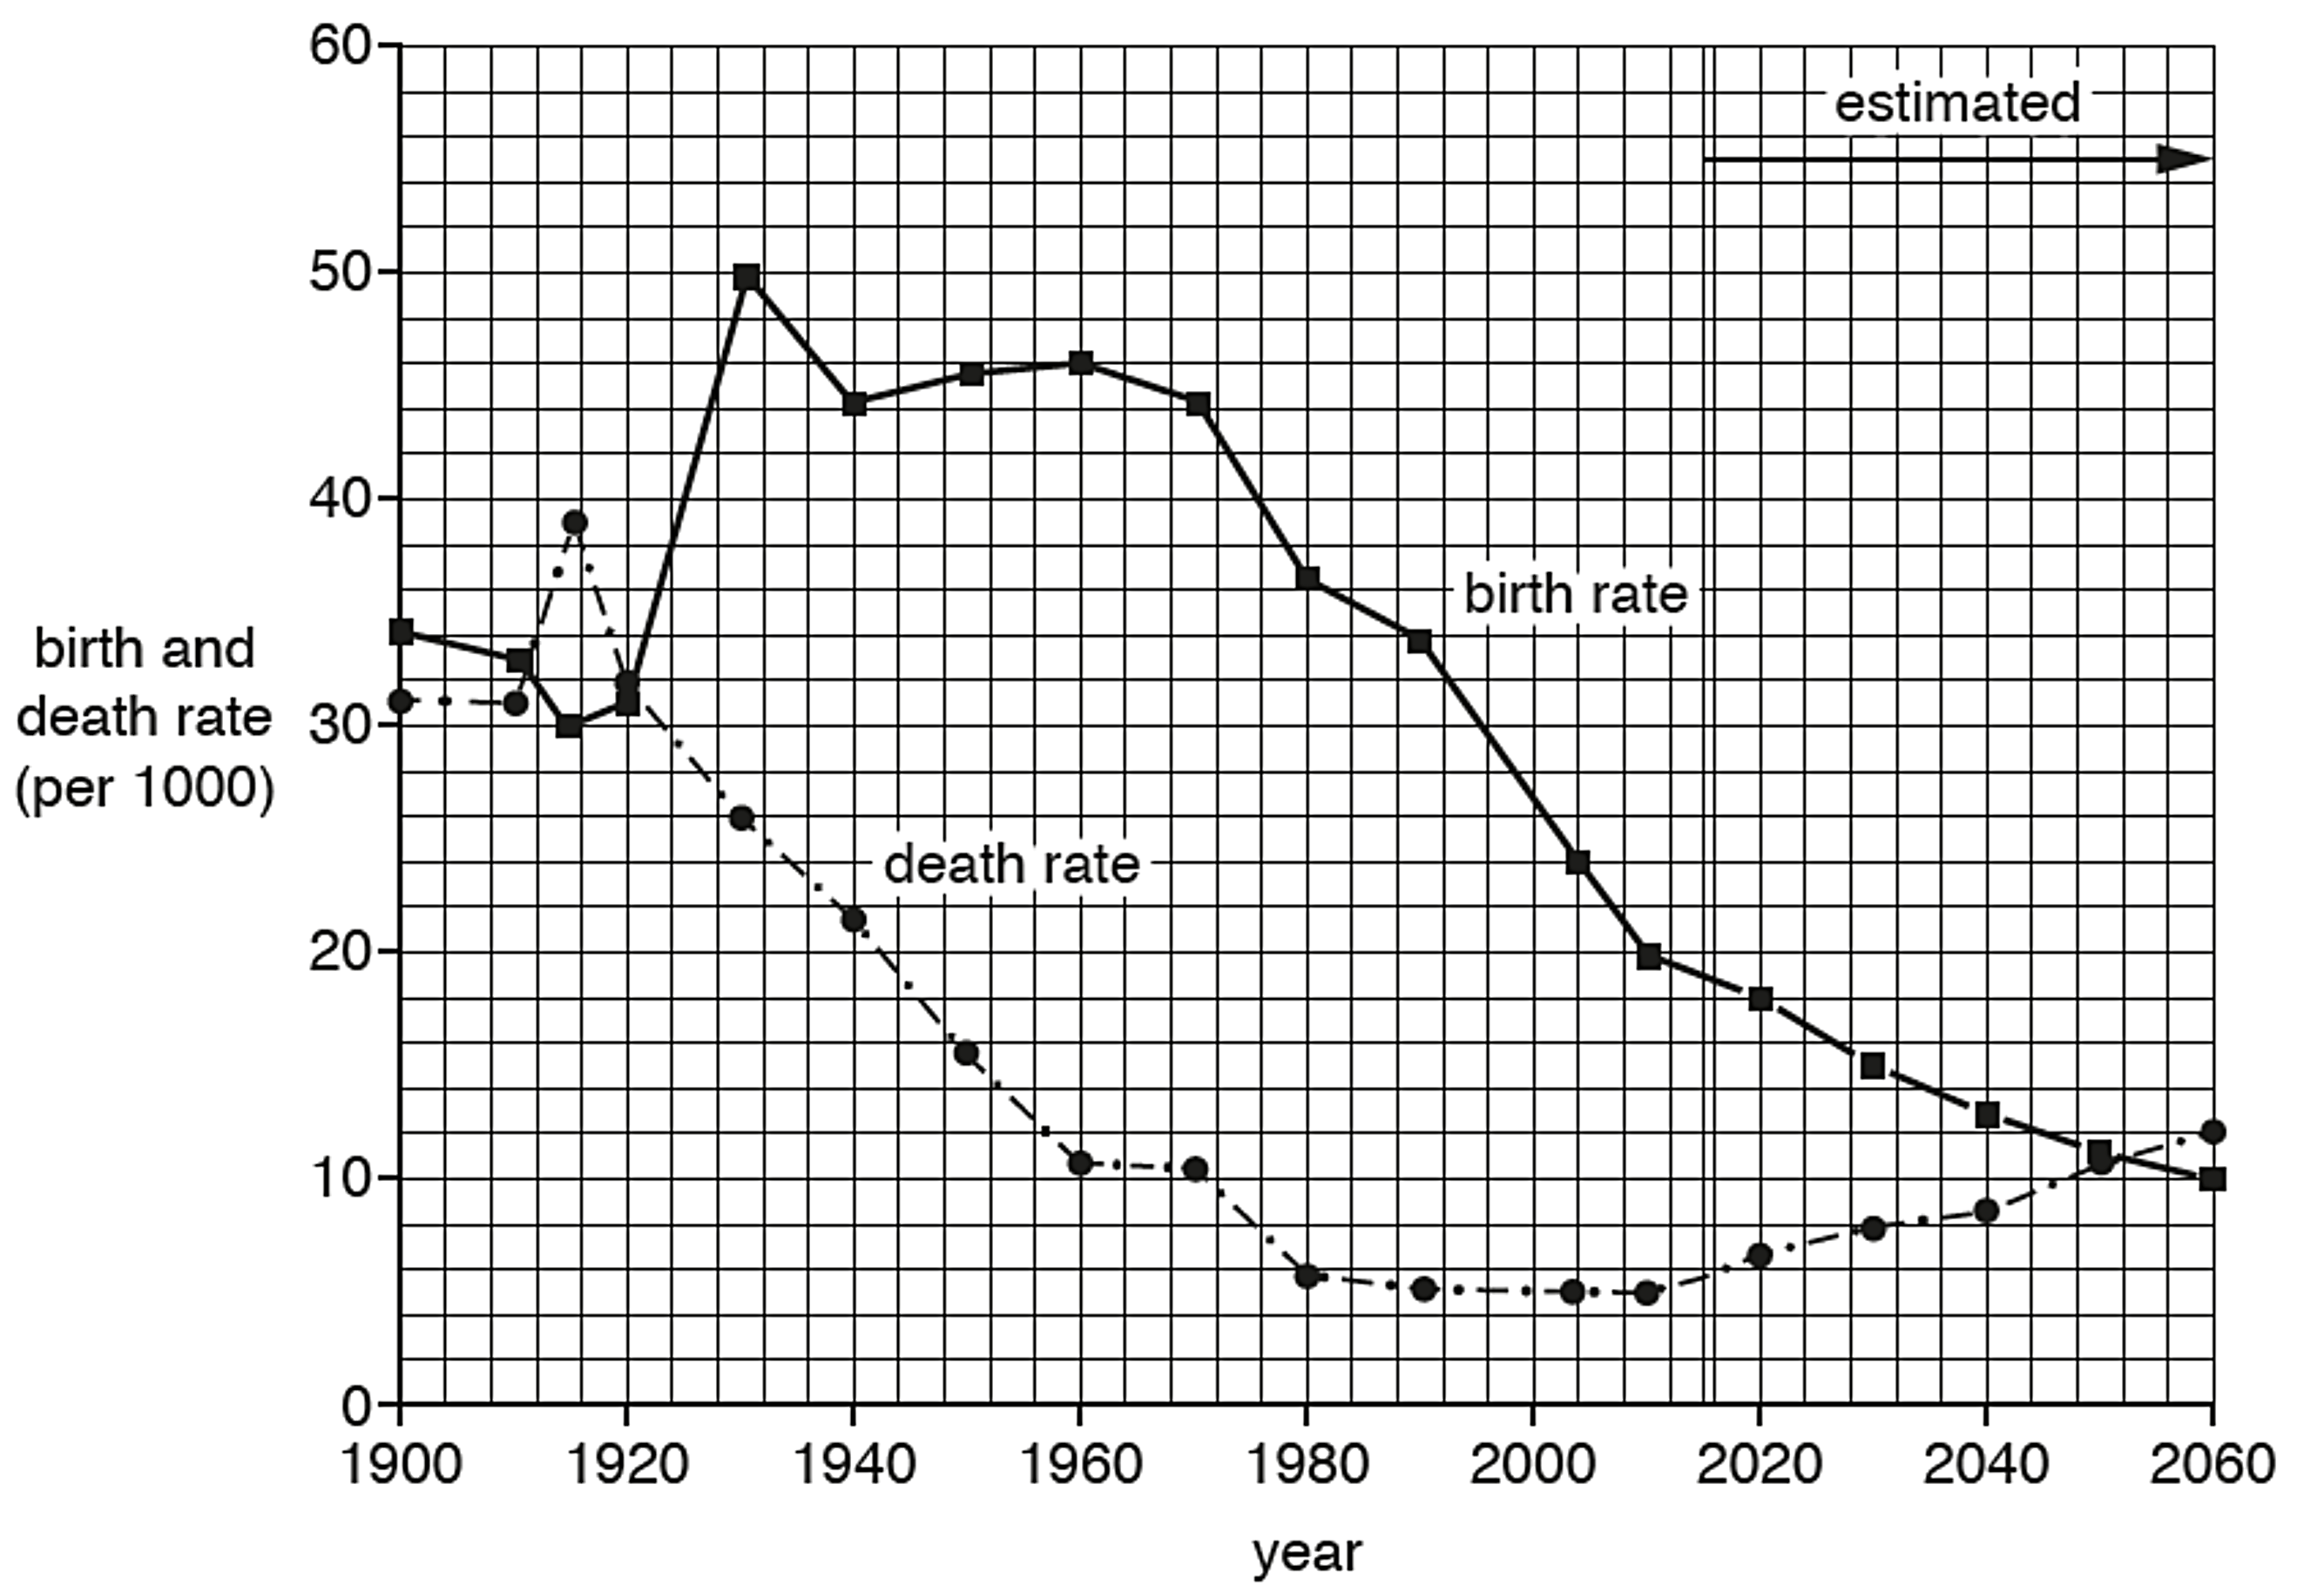
Which two of the following statements are true about birth and death rates in Mexico?
Choose your answer
Study Fig. 1.1, which shows information about birth rates and death rates in Mexico (an LIC) between 1900 and 2060 (estimated).
Which two of the following statements are true about birth and death rates in Mexico?