11 mark
Study Fig. 1.1, which shows information about birth rates and death rates in Mexico (an LIC) between 1900 and 2060 (estimated).
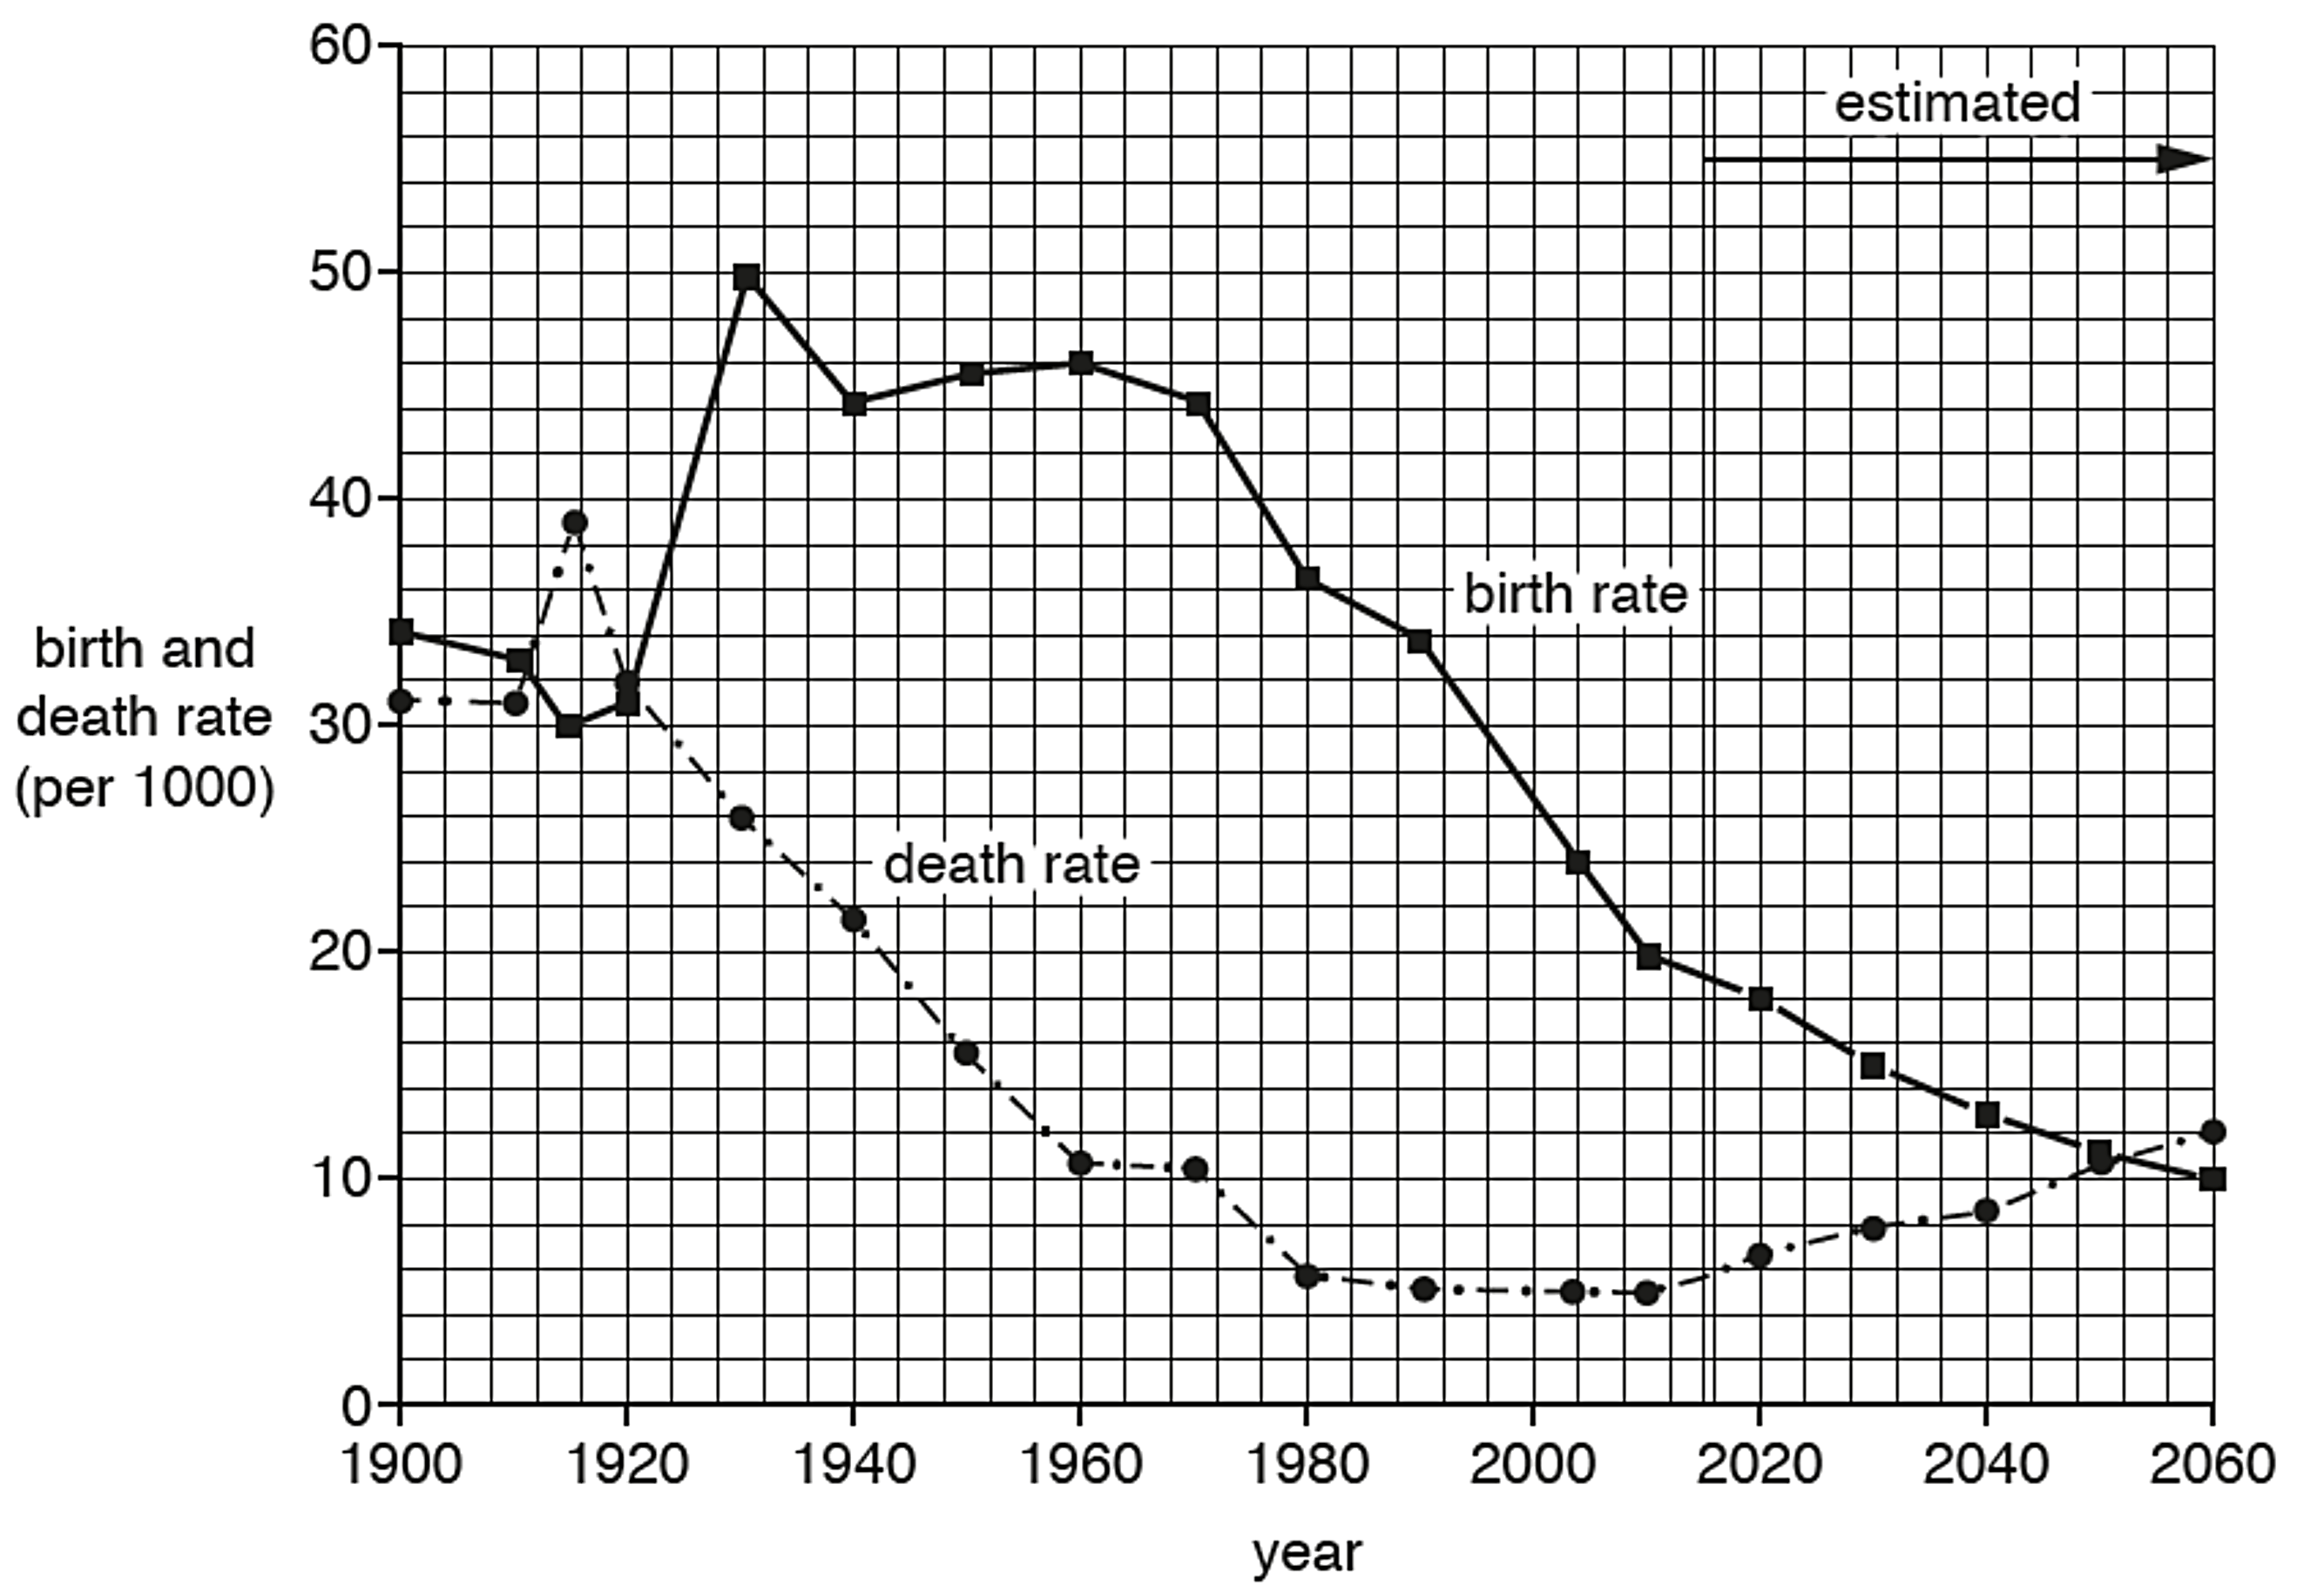
Calculate the natural population growth rate of Mexico in 2010.
You should show your calculations.
Study Fig. 1.1, which shows information about birth rates and death rates in Mexico (an LIC) between 1900 and 2060 (estimated).
Calculate the natural population growth rate of Mexico in 2010.
You should show your calculations.