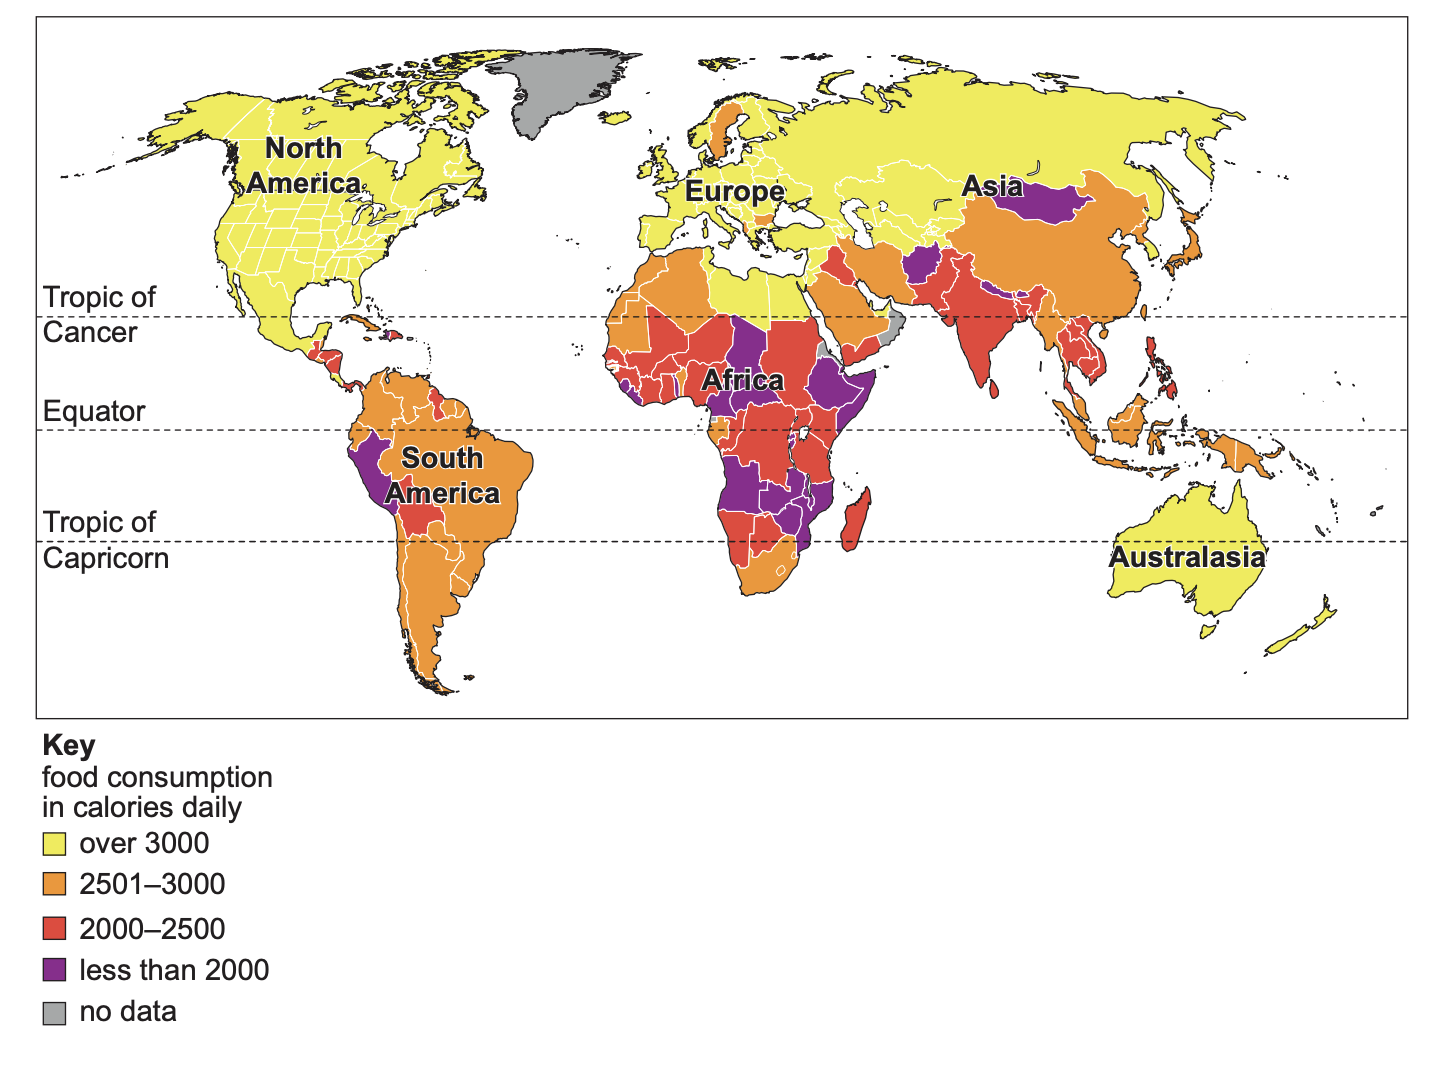
13 marksFull screenSaveStudy Fig. 5.2 (Insert), which shows information about food consumption in different parts of the world.Fig 5.2Using information from Fig. 5.2, suggest where shortage of food is most likely.Mark my answer🛟Question helpView answer