StudyDeck

Set A Paper 2: Theory Mock Exam

1:40:00
Answered0 / 10
Unanswered10

Questions

Question 1

[8 marks]

A cyclist starts from rest and accelerates along a straight, level road. The cyclist then travels at a constant speed before decelerating to a stop.

Fig. 1.1 shows the speed–time graph for the cyclist's journey.
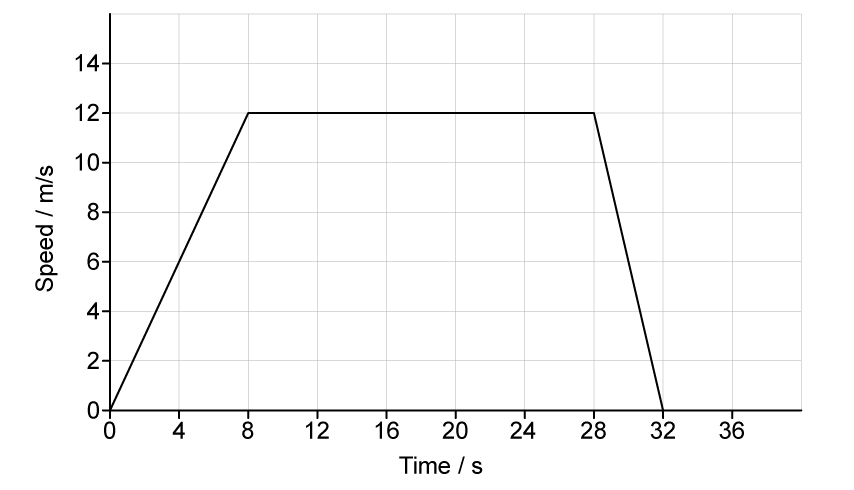
A speed–time graph with time in seconds on the x-axis ranging from 0 to 32, and speed in metres per second on the y-axis ranging from 0 to 14. The line starts at origin (0, 0), rises linearly to (8, 12), stays constant at 12 m/s from (8, 12) to (28, 12), then decreases linearly from (28, 12) to (32, 0).

Fig. 1.1

Define acceleration.