Causes of Climate Change
Specification link
This page covers section 5.1.1, 5.1.2 and 5.1.3 of the CIE O Level specification.
5.1.1 - Evidence of climate change: global temperature data, ice cores, sea ice positions, historic writing and paintings.
5.1.2 - Factors influencing natural climate change: orbital changes (Milankovitch cycles), sunspots, volcanic activity.
5.1.3 - The human influence on the atmosphere causing the enhanced greenhouse effect. For example, the use of fossil fuels, deforestation, agriculture.
Evidence of climate change
Evidence of climate change
The global climate conditions of the Earth change over time, leading to colder and warmer periods
The last 2.6 million years are the Quaternary period, when there have been 60 cold periods and warmer interglacial periods
The last ice age ended approximately 25,000 years ago
Evidence that change happened:
Ice cores have trapped ash, air bubbles and microbes
Preserved pollen
Historical sources such as diaries and art
Tree rings
Sea ice position
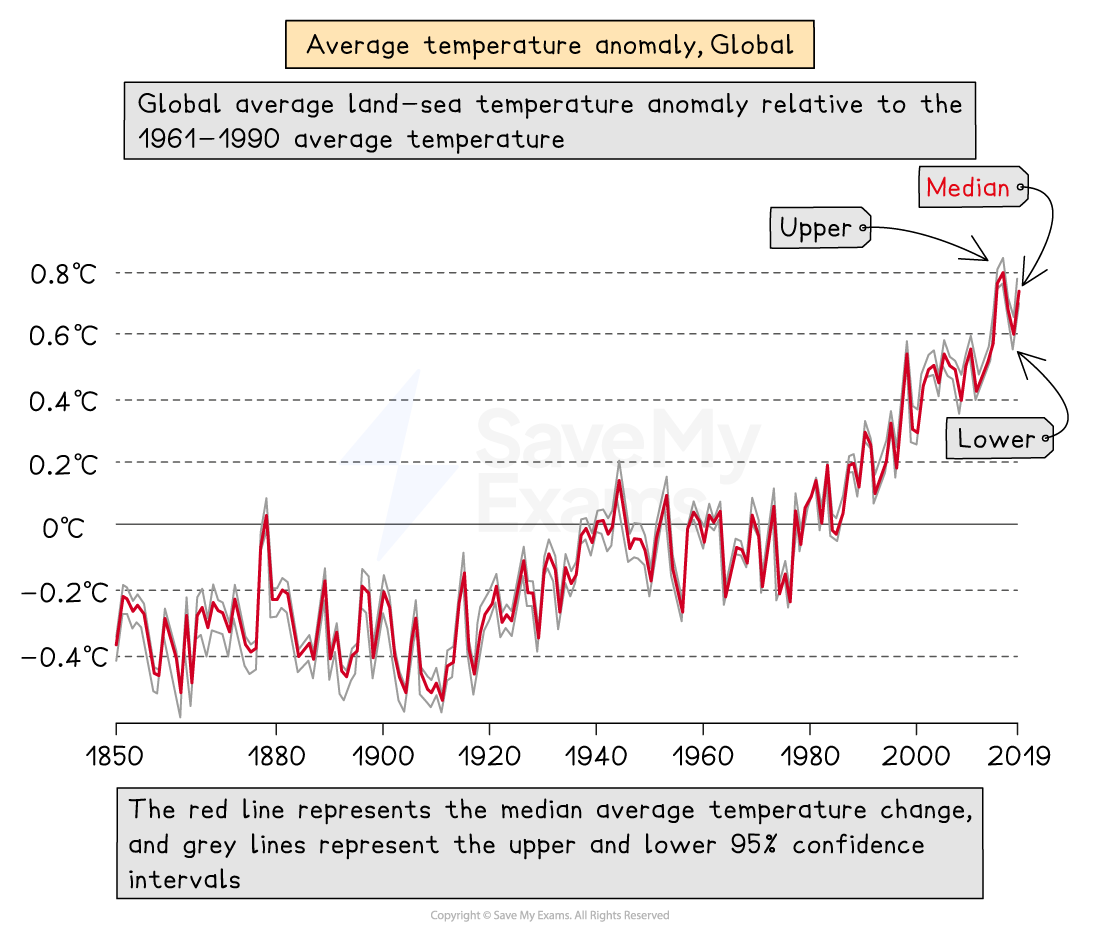
Over the last 200 years, we have had more accurate measurements of temperature
Factors affecting natural climate change
Factors affecting natural climate change
Milankovitch cycles
These are long-term changes to the Earth's orbit and position
This changes how much solar radiation the Earth receives
The Earth's orbit changes every 100,000 years. A more circular orbit leads to cooler periods and an elliptical orbit leads to warmer periods
The Earth's tilt varies every 41,000 years and the greater the tilt, the hotter the summers and the colder the winters are
Every 24,000 years the Earth wobbles on its axis and this can affect the seasonal temperatures

Volcanic eruptions
Large-scale eruptions lead to vast quantities of ash being ejected into the atmosphere
Ash in the atmosphere blocks solar radiation, leading to a decrease in temperatures
Sunspot activity
Increased sunspot activity is linked to higher average temperatures
Atmospheric dust
Asteroids and meteors entering the Earth's atmosphere may increase the amount of dust, which decreases temperatures
The enhanced greenhouse effect
The enhanced greenhouse effect
The greenhouse effect
The greenhouse effect is essential to the survival of life on Earth
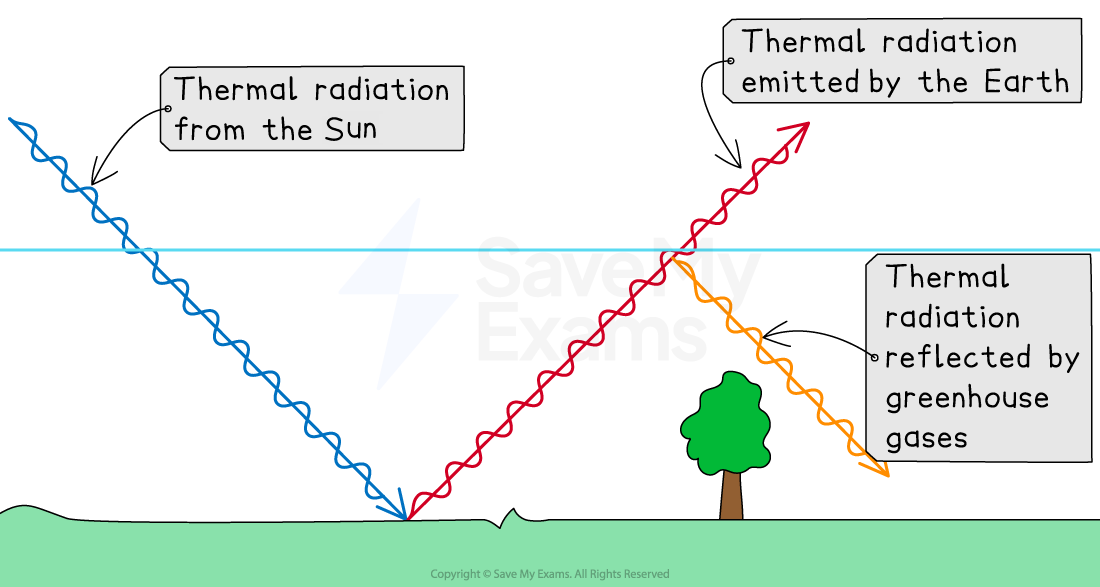
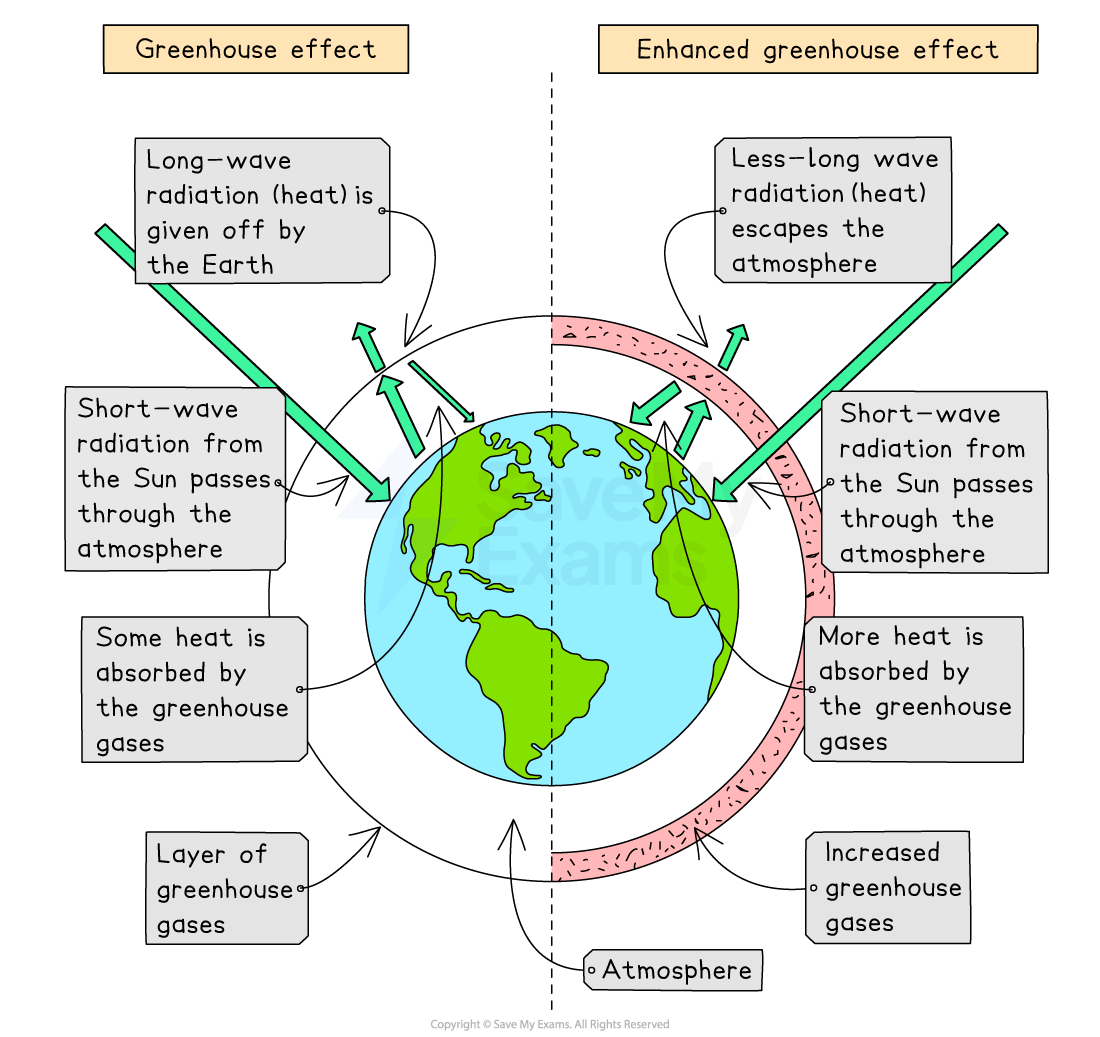
Greenhouse gases in the atmosphere allow short-wave radiation from the sun through to the Earth's surface
This is then radiated back into the atmosphere as long-wave radiation (heat)
The greenhouse gases absorb some of the long-wave radiation (heat) and stop it from radiating out into space
This maintains the Earth's average temperature
Without the greenhouse effect, the average temperature would be -18°C
Greenhouse gases from natural sources
Water vapour—evaporation from the oceans/seas and plants
Carbon dioxide—volcanic eruptions, wildfires and respiration
Methane is emitted from oceans and soils as part of decomposition; termites also emit methane
Nitrous oxide—soils and oceans
Human activity is increasing the number of greenhouse gases in the atmosphere
Carbon dioxide (CO₂) levels in the atmosphere have increased by more than 100 parts per million (ppm) to 420 ppm in 2020
The enhanced greenhouse effect
Population growth has led to:
higher energy demand
greater food production
more industrialisation
increased transport
All of these are increasing the proportions of greenhouse gases in the atmosphere
This has led to the enhanced greenhouse effect:
Less long-wave radiation (heat) can escape the atmosphere
Average global temperatures have increased over 1°C since pre-industrial times
Greenhouse gases from human activity
Carbon Dioxide (CO2) - the burning of fossil fuels, burning of wood and deforestation (less CO2 is removed from the atmosphere)
Methane (CH₄)—decaying organic matter, including manure and waste in landfills, rice fields and livestock
Nitrous Oxide (N₂O)—artificial fertilisers and burning of fossil fuels
Chlorofluorocarbons (CFCs)—aerosols, refrigeration, air conditioning