Variation
Types of Variation
Types of Variation
Variation is defined as differences between individuals of the same species
Phenotypic variation is the difference in features between individuals of the same species
Phenotypic variation can be caused in two main ways:
It can be genetic - controlled entirely by genes
Or it can be environmental - caused entirely by the environment in which the organism lives
Examples of genetic variation in humans include:
Blood group
Eye colour
Ability to roll tongue
Whether ear lobes are free or fixed
Earlobe variation diagram
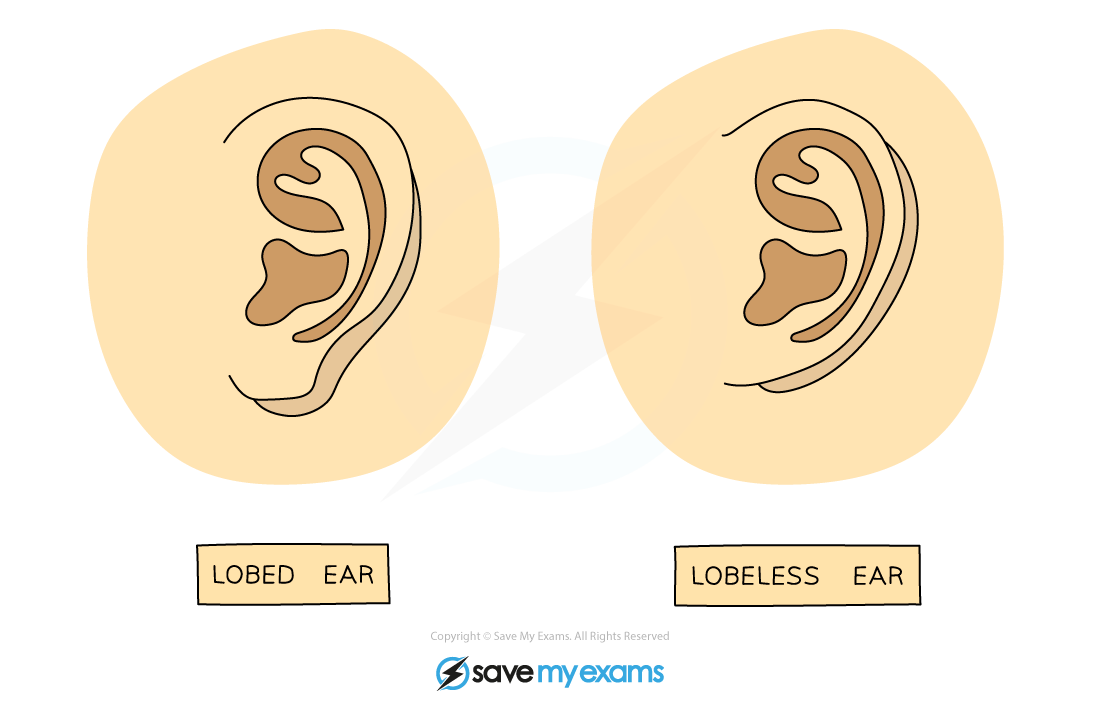
Whether earlobes are attached (lobeless) or free (lobed) is an example of genetic variation
Characteristics of all species can be affected by environmental factors such as climate, diet, accidents, culture and lifestyle
In this instance ‘environmental’ simply means ‘outside of the organism’ and so can include factors like climate, diet, culture, lifestyle and accidents during lifetime
Examples include:
An accident may lead to scarring on the body
Eating too much and not leading an active lifestyle will cause weight gain
Being raised in a certain country will cause you to speak a certain language with a certain accent
A plant in the shade of a big tree will grow taller to reach more light
Phenotypic variation can be divided into two types depending on how you are able to group the measurements:
Continuous variation
Discontinuous variation
Continuous Variation
Continuous variation is when there are very many small degrees of difference for a particular characteristic between individuals and they are arranged in order and can usually be measured on a scale
Examples include height, mass, finger length etc. where there can be many intermediate groups
Continuous features often vary because of a combination of genetic and environmental causes, for example:
Tall parents will pass genes to their children for height
Their children have the genetic potential to also be tall
However if their diet is poor then they will not grow very well
Therefore their environment also has an impact on their height
When graphs of this data is plotted, continuous variation gives smooth bell curves (a result of all the small degrees of difference)
Continuous variation bell-shaped curve
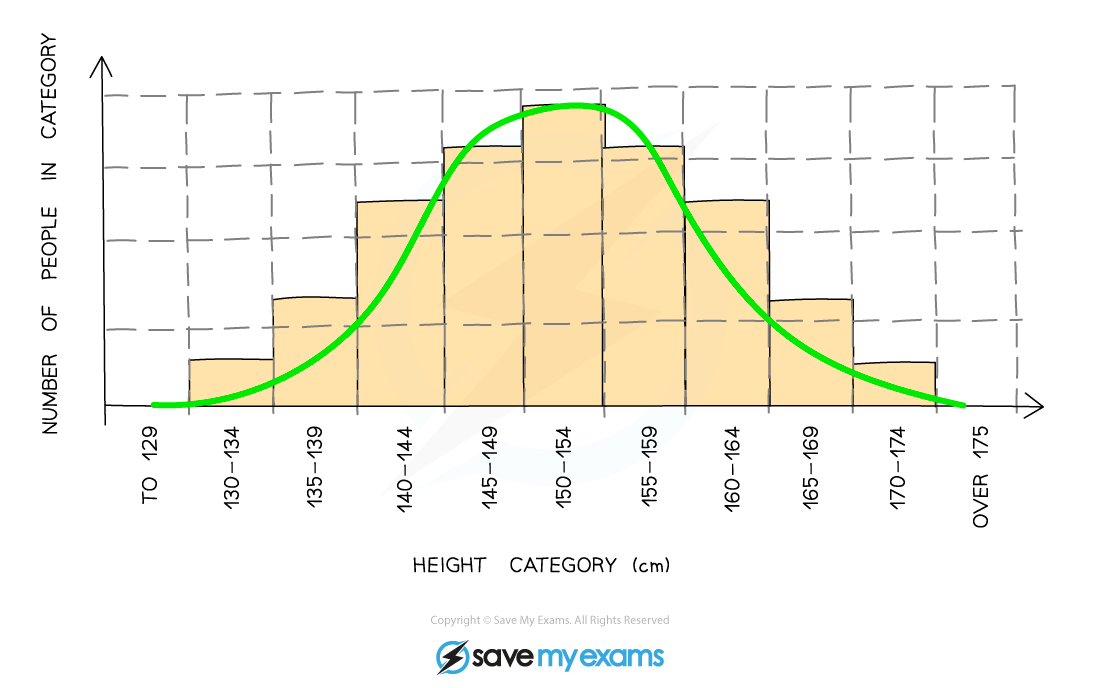
Height is an example of continuous variation which gives rise to a smooth bell-shaped curve when plotted as a graph
Discontinuous Variation
Discontinuous variation is when there are distinct differences for a characteristic
For example, people are either blood group A, B, AB or O; are either male or female; can either roll their tongue or not - there are no intermediary values
Seed shape and seed colour in peas are also examples of discontinuous variation
Discontinuous variation is usually caused by genetic variation alone
When graphs of these data are plotted it is presented on a bar chart
Bar chart of discontinuous variation
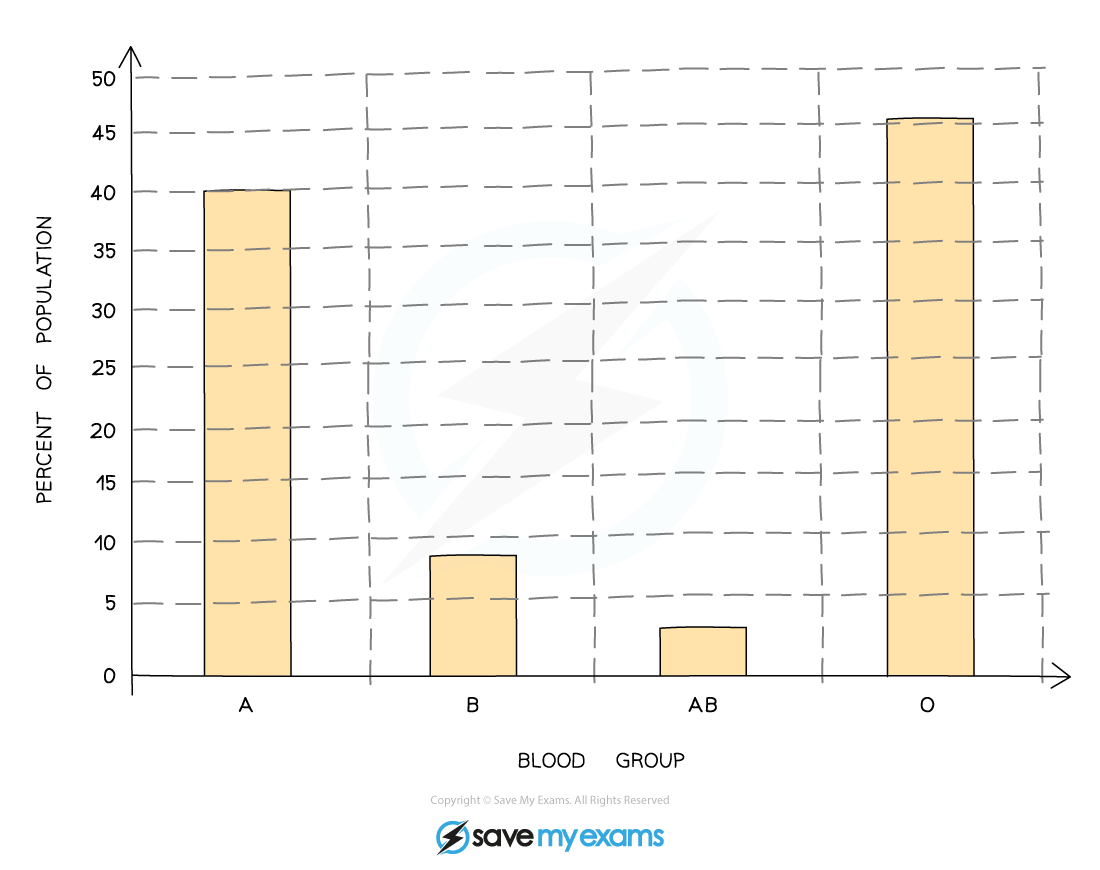
Blood group is an example of discontinuous variation which gives rise to a step-shaped graph
Investigating variation
There are various ways in which we can investigate examples of continuous and discontinuous variation
The example below shows an example of an investigation into discontinuous variation
Polymorphism in snails
Two species of snail from the same genus, Capaea, are found commonly in woodlands and grassland habitats in the UK
The different variations in shell pattern across the two snail species show polymorphic variation (poly = many, morphism = form)
There are four shell patterns:
Snail shell pattern variation diagram
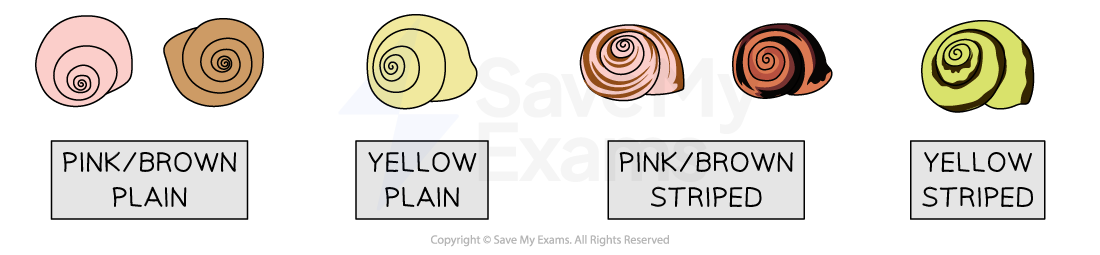
Snails in the genus Capaea show polymorphic variation due to the different shell patterns observed in different habitats
Investigating polymorphic variation in snails
We can investigate the frequency of the different patterns in the populations of snails in woodland and grassland areas to show the effect of habitat on variation
The method is as follows:
A representative sample of 50 snails from each habitat are photographed
Quadrat sampling could be used to select snails in a random sample in each habitat
Taking a photograph of the snails in their habitat means that no snails would need to be removed
This is an ethical consideration
For each habitat, the snails are categorised into one of the four different variants:
Pink/brown plain
Yellow plain
Pink/brown striped
Yellow striped
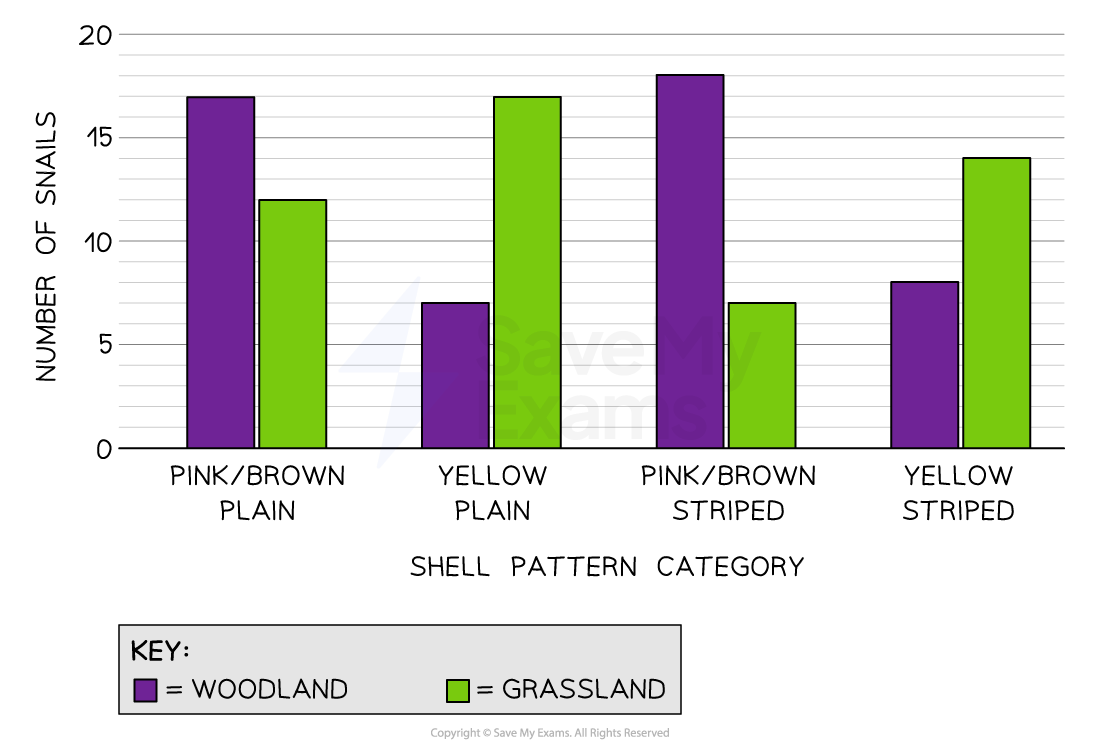
Results can be recorded in a table and presented in a bar chart for each habitat
Results
An efficient way to record the frequency of snails within each category is to use a tally chart:
Example of a tally chart for recording results
Snail type | Woodland | Grassland | ||||
Tally | Number | % | Tally | Number | % | |
Pink/brown plain | 17 | 34 | 12 | 24 | ||
Yellow plain | 7 | 14 | 17 | 34 | ||
Pink/brown striped | 18 | 36 | 7 | 14 | ||
Yellow striped | 8 | 16 | 14 | 28 | ||
These results can then be presented in a bar chart:
Example of a bar chart to represent tallied results
Results analysis and conclusions
Results analysis is about looking at the data to identify the key trends
In the table above, we can see that...
all snails were recorded in both habitats
more pink/brown striped and pink/brown plain snails recorded in woodland compared to grassland
more yellow plain and yellow striped snails recorded in grassland compared to woodland
more than double the number of yellow plain snails recorded in grassland compared to woodland
more than double the number of pink/brown striped snails recorded in woodland compared to grassland
Conclusions are then made to try and explain the patterns seen in the results
Questions that might be relevant when writing conclusions for the results above might include:
Can the four categories of snail patterns be considered common in both habitats?
Are there more snails with a certain shell pattern found in one habitat because they are more adapted to that habitat?
Do the results suggest that the habitat has an impact on the variation of snails?
Evaluating your methods
In an evaluation, you should consider the strengths and limitations of your investigation
The sampling techniques used to collect the results will determine how representative the sample is and therefore how valid the results are
How was the area in the habitat selected?
Were the snails collected randomly?
Was the sample size big enough?
How were snails located within the habitat?
Were some snails less obvious than others due to camouflage? Did these snails get missed in the sampling techniques?
Did methods take into account the ethical considerations?
Snails are live animals so methods should be designed to prevent any harm