Interpreting Data
Interpreting Datavideo
Interpreting Data
Data recorded in rate studies is used to plot graphs to calculate the rate of a reaction
Plotting a graph until the completion of the reaction shows how the rate changes with time
Over time the rate of reaction slows as the reactants are being used up so the line becomes less steep and eventually becomes horizontal, indicating the reaction has finished
You can plot more than one run of a variable on the same graph making it easier to see how the variable influences the rate
For example, plotting the effect of concentration on a reaction between the acid and marble chips
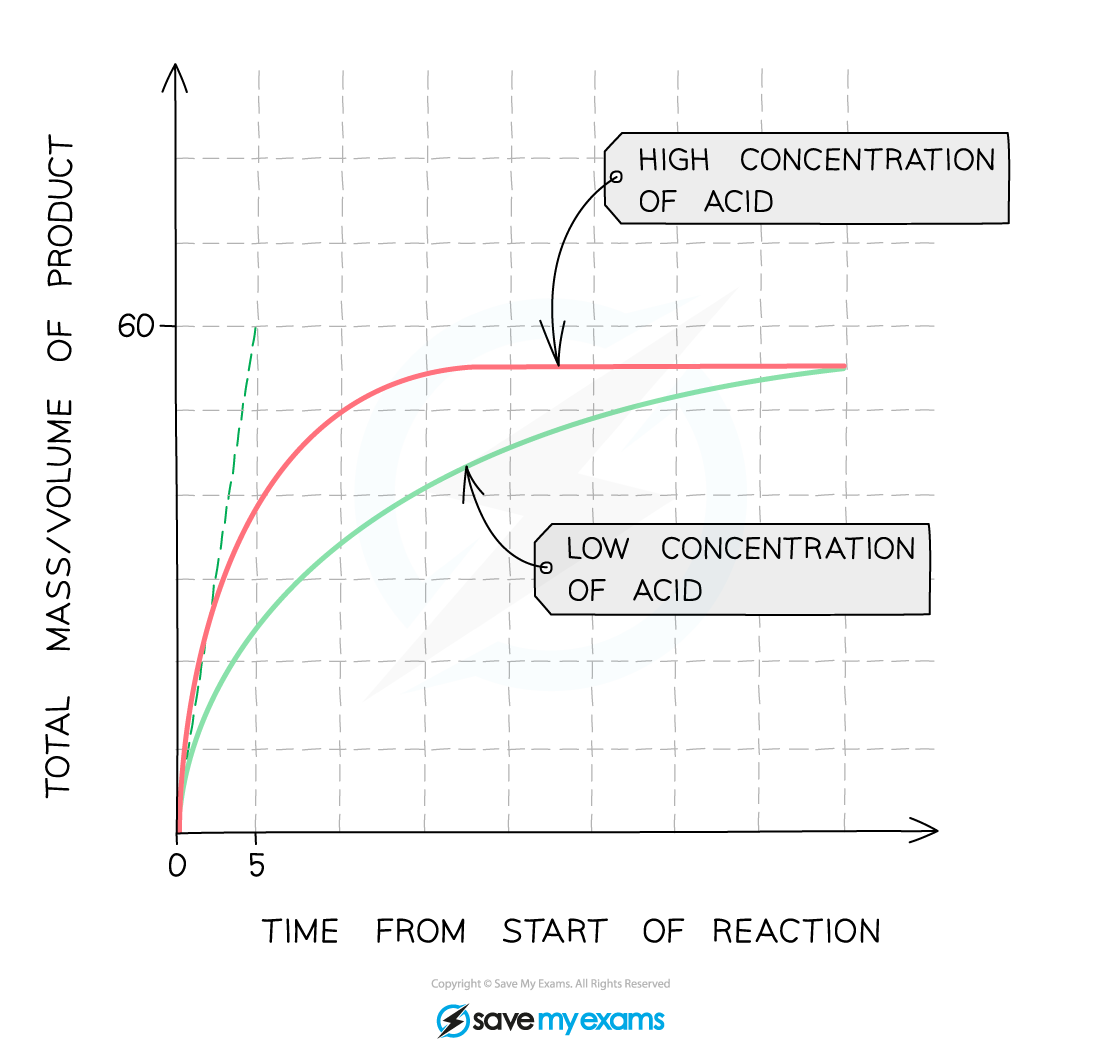
The steeper the curve, the faster the rate of the reaction
The curve is steepest initially so the rate is quickest at the beginning of the reaction
As the reaction progresses, the concentration of the reactants decreases and the rate decreases shown by the curve becoming less steep
When one of the reactants is used up, the reaction stops, the rate becomes zero and the curve levels off to a horizontal line
The amount of product formed in a reaction is determined by the limiting reactant:
If the amount of limiting reactant increases, the amount of product formed increases
If the amount of the reactant in excess increases, the amount of product remains the same
Drawing a tangent to the slope allows you to show the gradient at any point on the curve
The steeper the slope, the quicker the rate of reaction
The volume of a gaseous product would increase to a maximum over time, so the line levels out indicating the reaction is over
Since the volume and mass would be proportional, this could also be a graph of the mass of product versus time
Calculating the Rate of Reaction at a Particular Point
To do this you need to find the gradient of the curve at that point
To do this a tangent is drawn to the curve and then the gradient of the tangent calculated