Types of map
Topographical & thematic maps
The cartographic skills on the previous revision note are used on topographical maps
The exam will also include the interpretation of a range of thematic maps
Thematic maps
Thematic maps
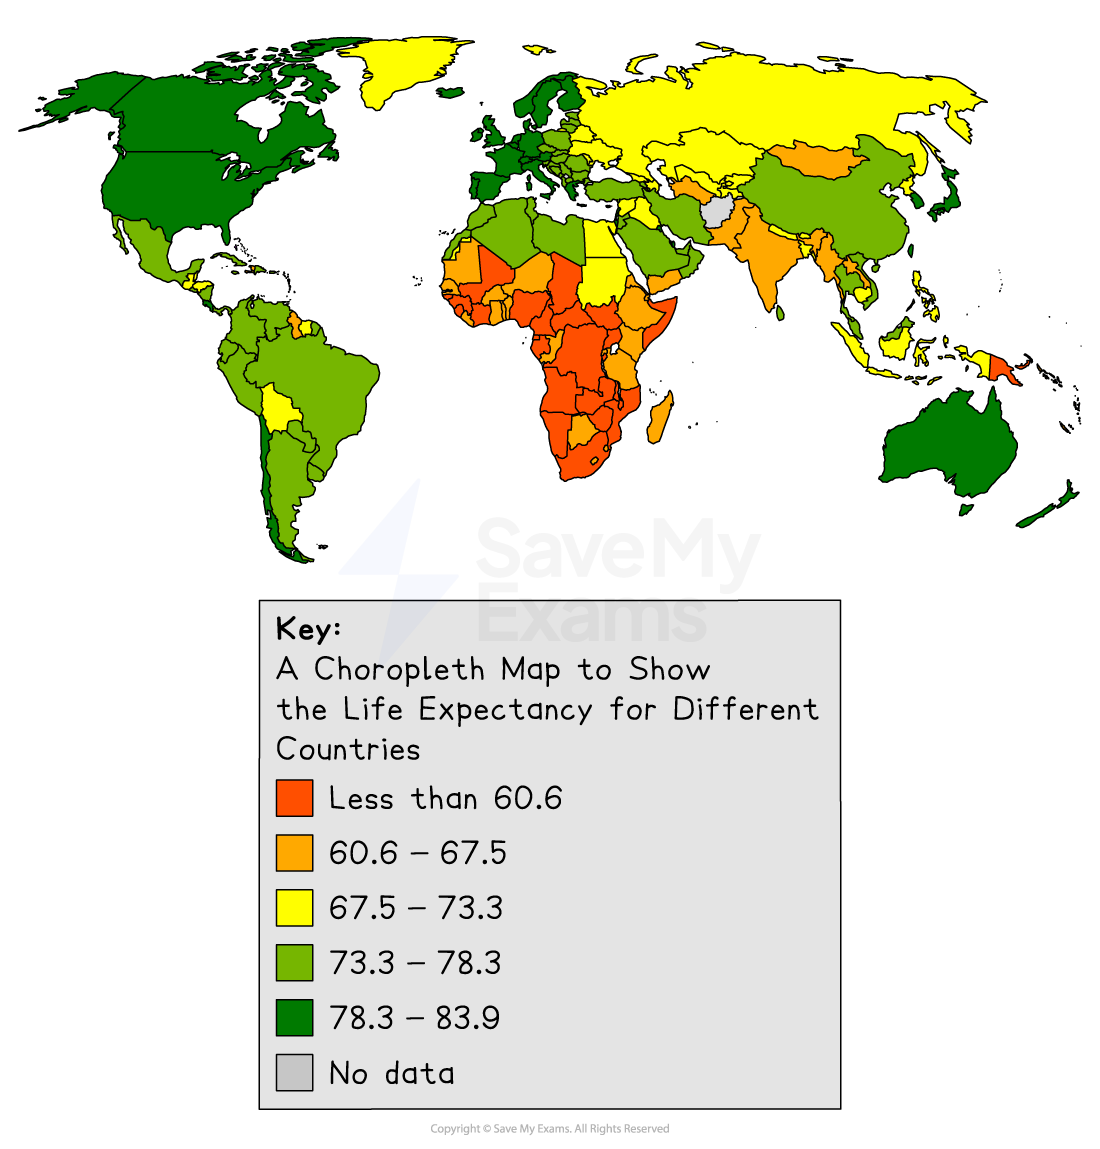
Choropleth maps
Choropleth maps are shaded according to a pre-arranged key
Each shade represents a range of values
It is common for one colour in different shades to be used
Can be used for a range of data, such as annual precipitation, population density, income levels, etc.
Isoline maps
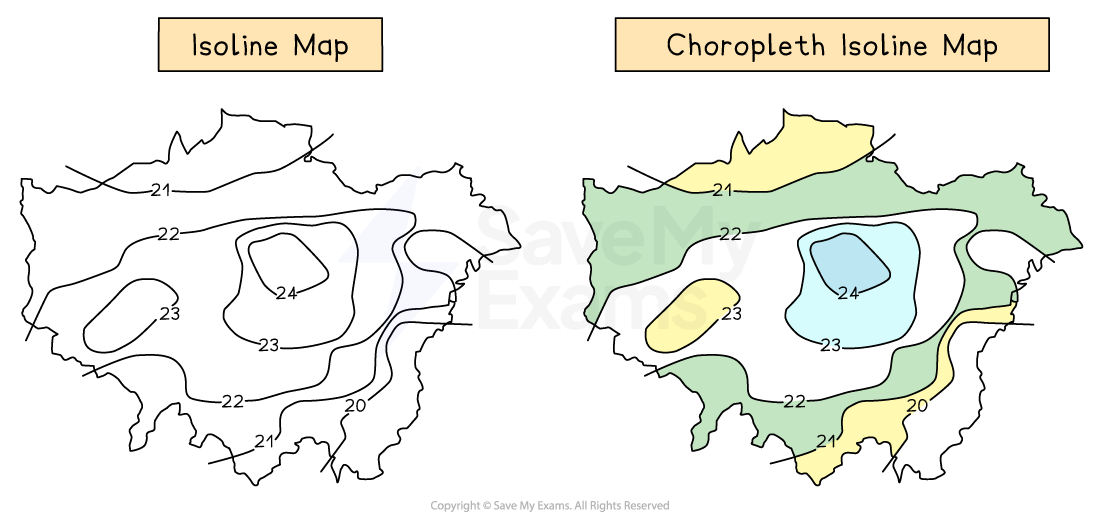
Isolines are lines on a map which join places of equal value, such as isobars, which join places of equal pressure or contour lines, which join places of equal height
Isoline maps become choropleth isoline maps when shaded between the isolines
Shading is progressive from light to dark
The heaviest (darkest) shading is for the largest value
Describing and analysing maps
Describing and analysing maps
The geography exam papers will include a range of maps which need to be described and/or analysed as part of the questions
The questions may also require comparison of maps for example, two maps showing data from different years
Describing maps
When describing maps, the following can be included:
Direction: Use compass points (N, NE, SW etc.) to describe where things are
Scale: Look at the scale to understand distances (e.g. 1cm = 1km)
Symbols: Use the map key to interpret what different symbols mean (e.g. roads, rivers, urban areas)
Relief: Describe the height and shape of the land using:
Contour lines (close = steep; far = gentle)
Colour shading (e.g. brown = high land, green = low)
Patterns: Point out patterns or distributions (e.g. clustered, linear, scattered).
Human features: Describe towns, roads, and land use (e.g. residential, industrial).
Physical features: Mention rivers, hills, coasts, forests, etc.
First tasks when looking at an unfamiliar map:
Title & purpose: Always check what the map shows (e.g. population, land use, rainfall)
Location: Identify where the place is – name of country, region, or city
Descriptions of maps should:
Start with general statements about the key features, for example, 'active volcanoes are mostly found on plate boundaries'
Add more detail by mentioning specific regions or places; it is good to name countries or features. For example, the majority of active volcanoes are located around the Pacific 'Ring of Fire' in areas such as the west coast of South America and Japan
For a more detailed description, you may also want to mention anomalies (examples which do not fit the pattern/trend). For example, 'However, some volcanoes are located away from the plate boundaries on hot spots including those which are in Hawaii
Analysing maps
Analysis of maps involves examining the maps and interpreting the data shown to extract information and reach conclusions
Successful analysis of maps may include:
Comparison: Identifying similarities and differences between places on the map or between different maps
Explanation of patterns: Suggest reasons for patterns seen (e.g. why towns are near rivers)
Links to geographical themes: Use knowledge of physical or human geography to interpret features (e.g. how relief affects farming)
Use of specific examples: Refer to named places or grid references where possible
Direction and distance: Analyse how far and in what direction things are from each other
Changes over time (if applicable): Comment on how a place has changed using historical vs current maps
Use of OS Map Skills (for topographic maps):
4-figure grid references: to locate larger areas
6-figure grid references: for precise points
Compass directions and bearings: for accurate description of direction
Scale and measurement: to calculate distances