Domain & Range
Domain & Rangevideo
Domain & range
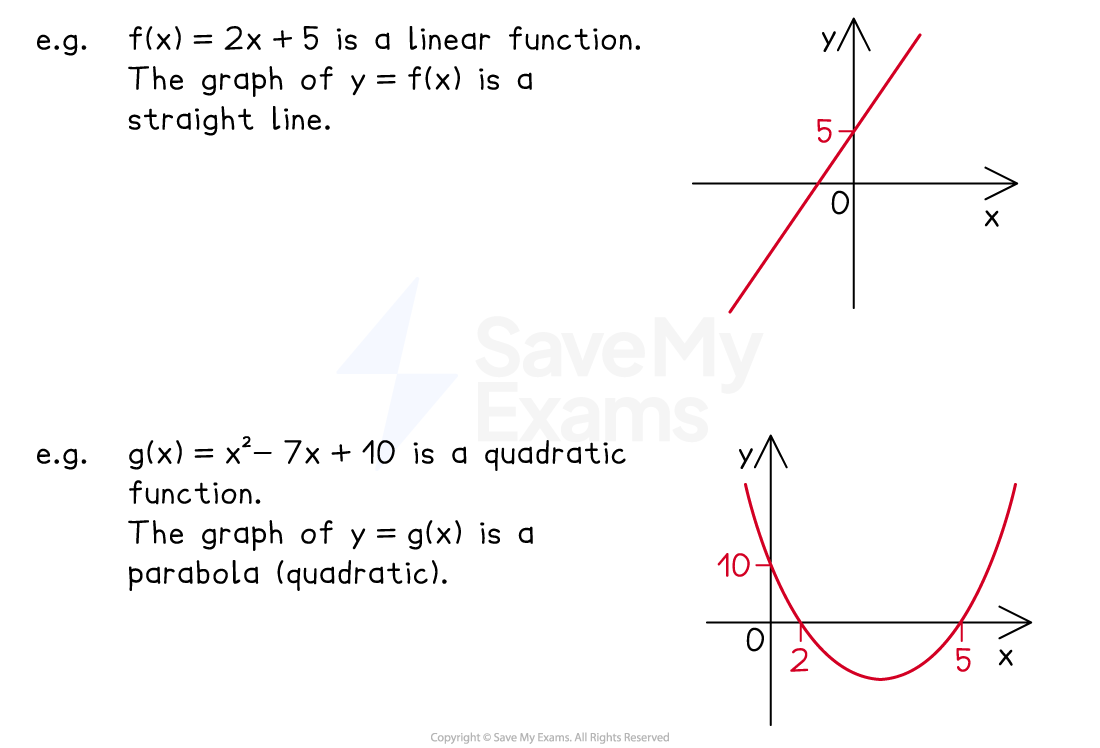
How are functions related to graphs?
Functions can be represented as graphs on x and y axes
The x-axis values are the inputs
The y-axis values are the outputs
To see what graph to plot, replace with
What is the domain?
The domain of a function is the set of all inputs that the function is allowed to take
Domains can be described in words
Domains must refer to x
not y or f(x)
You can use "not equal to" ≠ if needed
You can use inequality signs if needed
What are examples of domains?
Examples of domains are below:
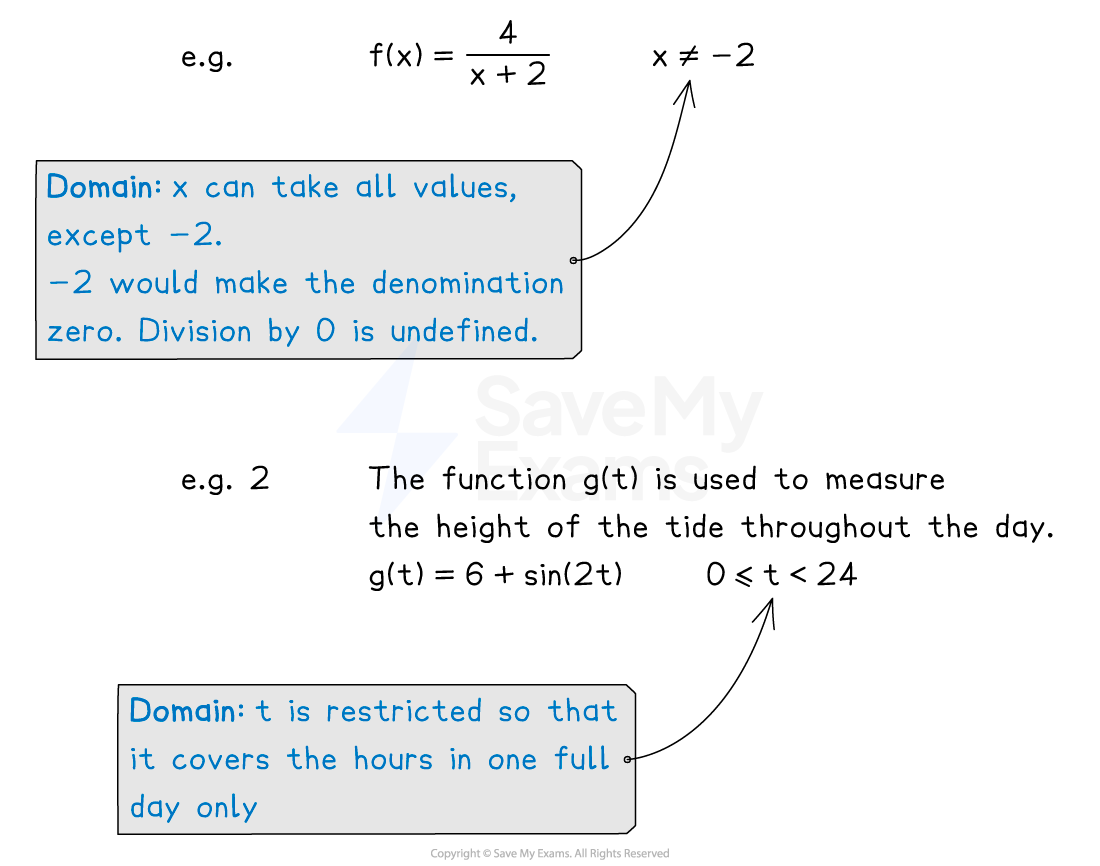
takes any x value except 0 (you cannot divide by 0)
The domain is "all values of x except 0", or simply "x ≠ 0"
takes any x value that is not negative (you cannot take the square root of a negative)
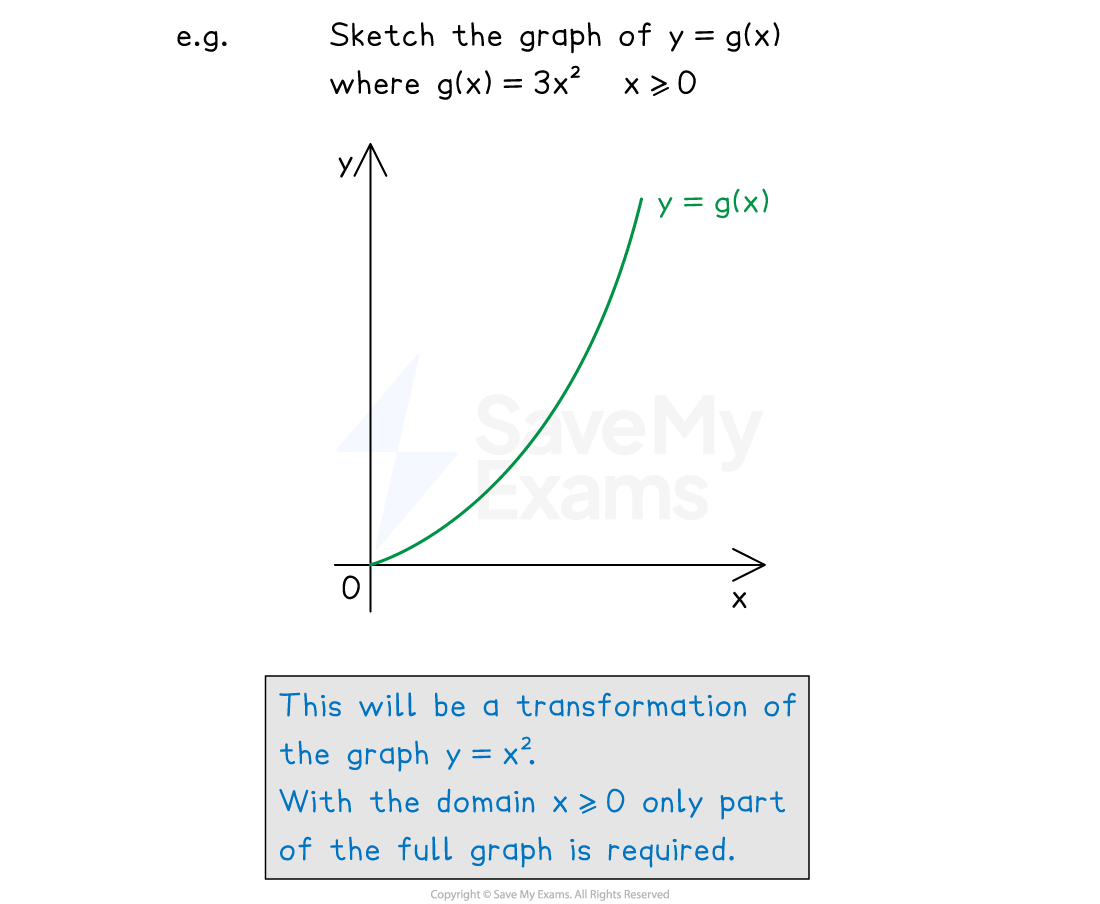
The domain is "x ≥ 0"
takes any x value (negative x values are fine as inputs)
The domain is "all values of x"
takes any x value
The domain is "all values of x"
What are restricted domains and values excluded from domains?
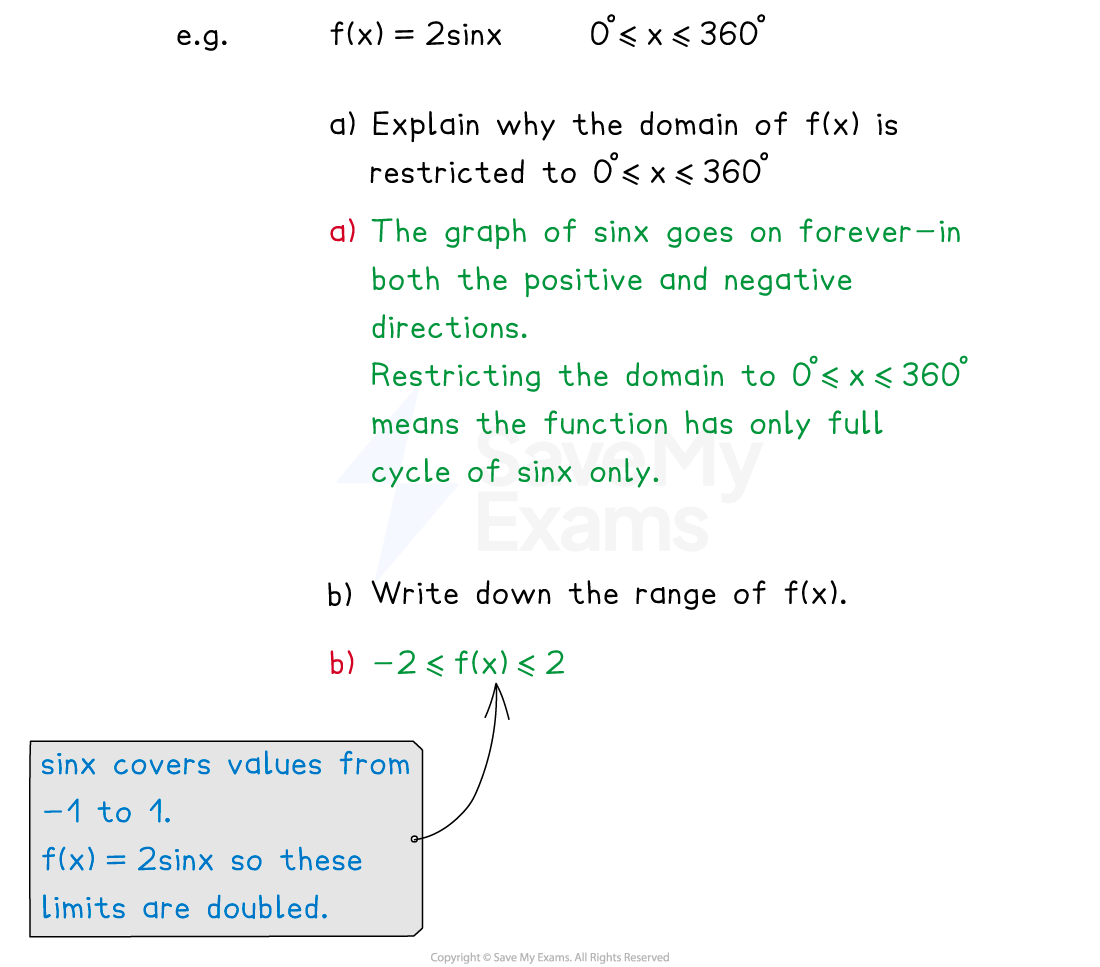
Some domains are restricted by choice
with the domain 0 < x < 5
This question wants to concentrate on that domain only (even though bigger domains exist)
Some domains must exclude certain values (or sets of values)
must exclude x = 1 and x = -7 from any domain
These two inputs make the function undefined (dividing by zero)
must exclude x < 3 from any domain
Any input in x < 3 leads to square-rooting a negative
What is the range?
The range of a function is the set of all outputs that the function gives out
Ranges can be described in words
Ranges must refer to f(x)
not x or y
You can use "not equal to" ≠ if needed
You can use inequality signs if needed
Ranges depend on domains
Examples of ranges are below:
with the domain x > 0
If x = 0 then f(0) = 3(0) + 2 = 2
The range is "f(x) > 2"
This is because if all inputs are greater than 0, all outputs will be greater than 2
This could be seen from a sketch or by substituting inputs of x > 0 into f(x)
with domain "all values of x"
The range is f(x) ≥ 0
This is because all values of x get squared (so no negative outputs are created)
Any negative value that goes in comes out positive
(0 goes in and comes out as 02 = 0)
How can I use graphs to find ranges?
Ranges are easier if you know the shapes of different types of graphs
For example, the shapes of , , , trig graphs, etc
They may also involve graph transformations