StudyDeck

Drawing Cumulative Frequency Diagrams

Exam code: 4024
Written by: Ashika|Reviewed by: Caroline Carroll|Updated 2 July 2026

Drawing Cumulative Frequency Diagramsvideo

Drawing Cumulative Frequency Diagrams

Drawing cumulative frequency diagrams

What is a cumulative frequency diagram?

  • A cumulative frequency diagram is a way of representing grouped continuous data

  • A cumulative frequency diagram can be used to estimate other statistical values

    • For example the median, quartiles or percentiles

How do I draw a cumulative frequency diagram?

  • This is best explained with an example

    • The times taken to complete a short general knowledge quiz taken by 50 students are shown in the table below:

      Time taken (s{"language":"en","fontFamily":"Times New Roman","fontSize":"18","autoformat":true} seconds)

      Frequency

      25≤s<30{"fontFamily":"Times New Roman","fontSize":"18","autoformat":true,"toolbar":""}

      3

      30≤s<35{"language":"en","fontFamily":"Times New Roman","fontSize":"18","autoformat":true}

      8

      35≤s<40{"language":"en","fontFamily":"Times New Roman","fontSize":"18","autoformat":true}

      17

      40≤s<45{"language":"en","fontFamily":"Times New Roman","fontSize":"18","autoformat":true}

      12

      45≤s<50{"language":"en","fontFamily":"Times New Roman","fontSize":"18","autoformat":true}

      7

      50≤s<55{"language":"en","fontFamily":"Times New Roman","fontSize":"18","autoformat":true}

      3

      Total

      50

    • Then the cumulative frequency is the running total of the frequencies

      Time taken (s{"language":"en","fontFamily":"Times New Roman","fontSize":"18","autoformat":true} seconds)

      Frequency

      Cumulative Frequency

      25≤s<30{"fontFamily":"Times New Roman","fontSize":"18","autoformat":true,"toolbar":""}

      3

      3

      30≤s<35{"fontFamily":"Times New Roman","fontSize":"18","autoformat":true,"toolbar":""}

      8

      3 + 8 = 11

      35≤s<40{"fontFamily":"Times New Roman","fontSize":"18","autoformat":true,"toolbar":""}

      17

      11 + 17 = 28

      40≤s<45{"fontFamily":"Times New Roman","fontSize":"18","autoformat":true,"toolbar":""}

      12

      28 + 12 = 40

      45≤s<50{"fontFamily":"Times New Roman","fontSize":"18","autoformat":true,"toolbar":""}

      7

      40 + 7 = 47

      50≤s<55{"fontFamily":"Times New Roman","fontSize":"18","autoformat":true,"toolbar":""}

      3

      47 + 3 = 50

      Total

      50

  • We can now draw the cumulative frequency diagram

    • The most important part is that cumulative frequency is plotted against the end (upper bound) of the class interval

      • The end of the class interval is the x-coordinate

      • The cumulative frequency is the y-coordinate

      • For the above example the first two points to plot would be (30, 3) and (35, 11)

    • To explain this, consider the second row (30≤s<35{"language":"en","fontFamily":"Times New Roman","fontSize":"18","autoformat":true})

      • The 8 students in this group could have taken any time between 30 and 35 seconds

      • They cannot all be guaranteed to have been accounted for until we reach 35 seconds

    • Once all points from the table are plotted, a point for the start needs to be added

      • This will be at the lowest time from the table

      • i.e. at 25 seconds with a cumulative frequency of 0

      • Plot the point (25, 0)

    • Join points up with a smooth curve (this takes some practice)

      • Make sure it goes through all of the marked points

    • In general a cumulative frequency diagram has a stretched-S-shape appearance

      • A cumulative frequency diagram will never come back towards the x-axis

  • Here is the final cumulative frequency diagram for the quiz times
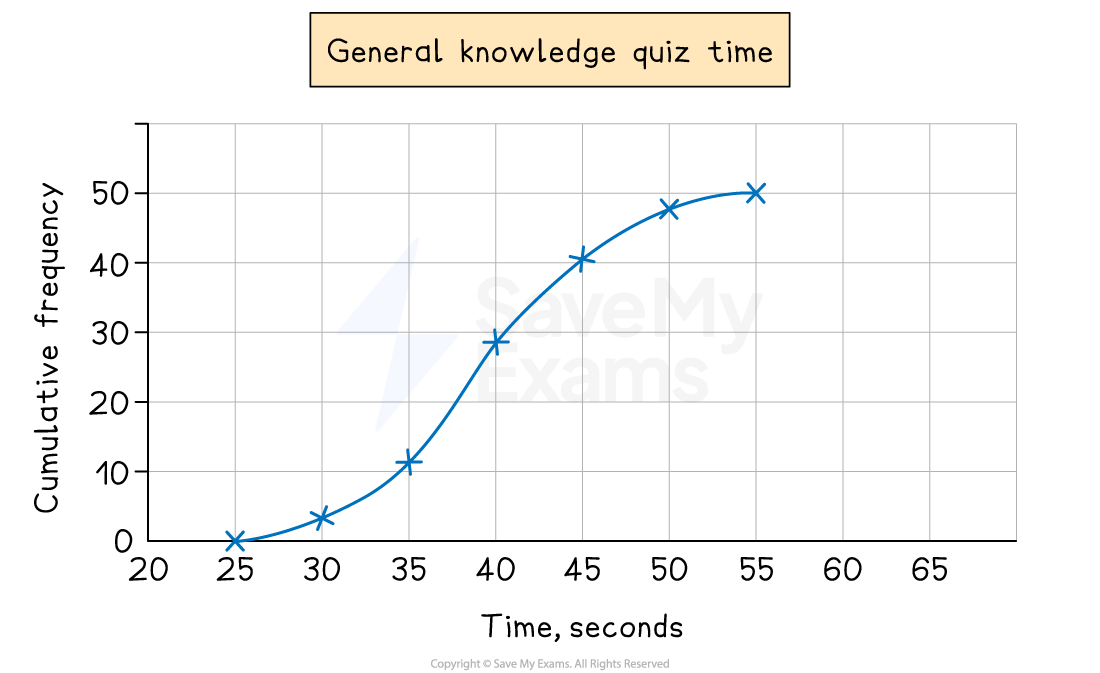
Cumulative frequency diagram for time to complete a quiz for 50 students
Example of a cumulative frequency diagram