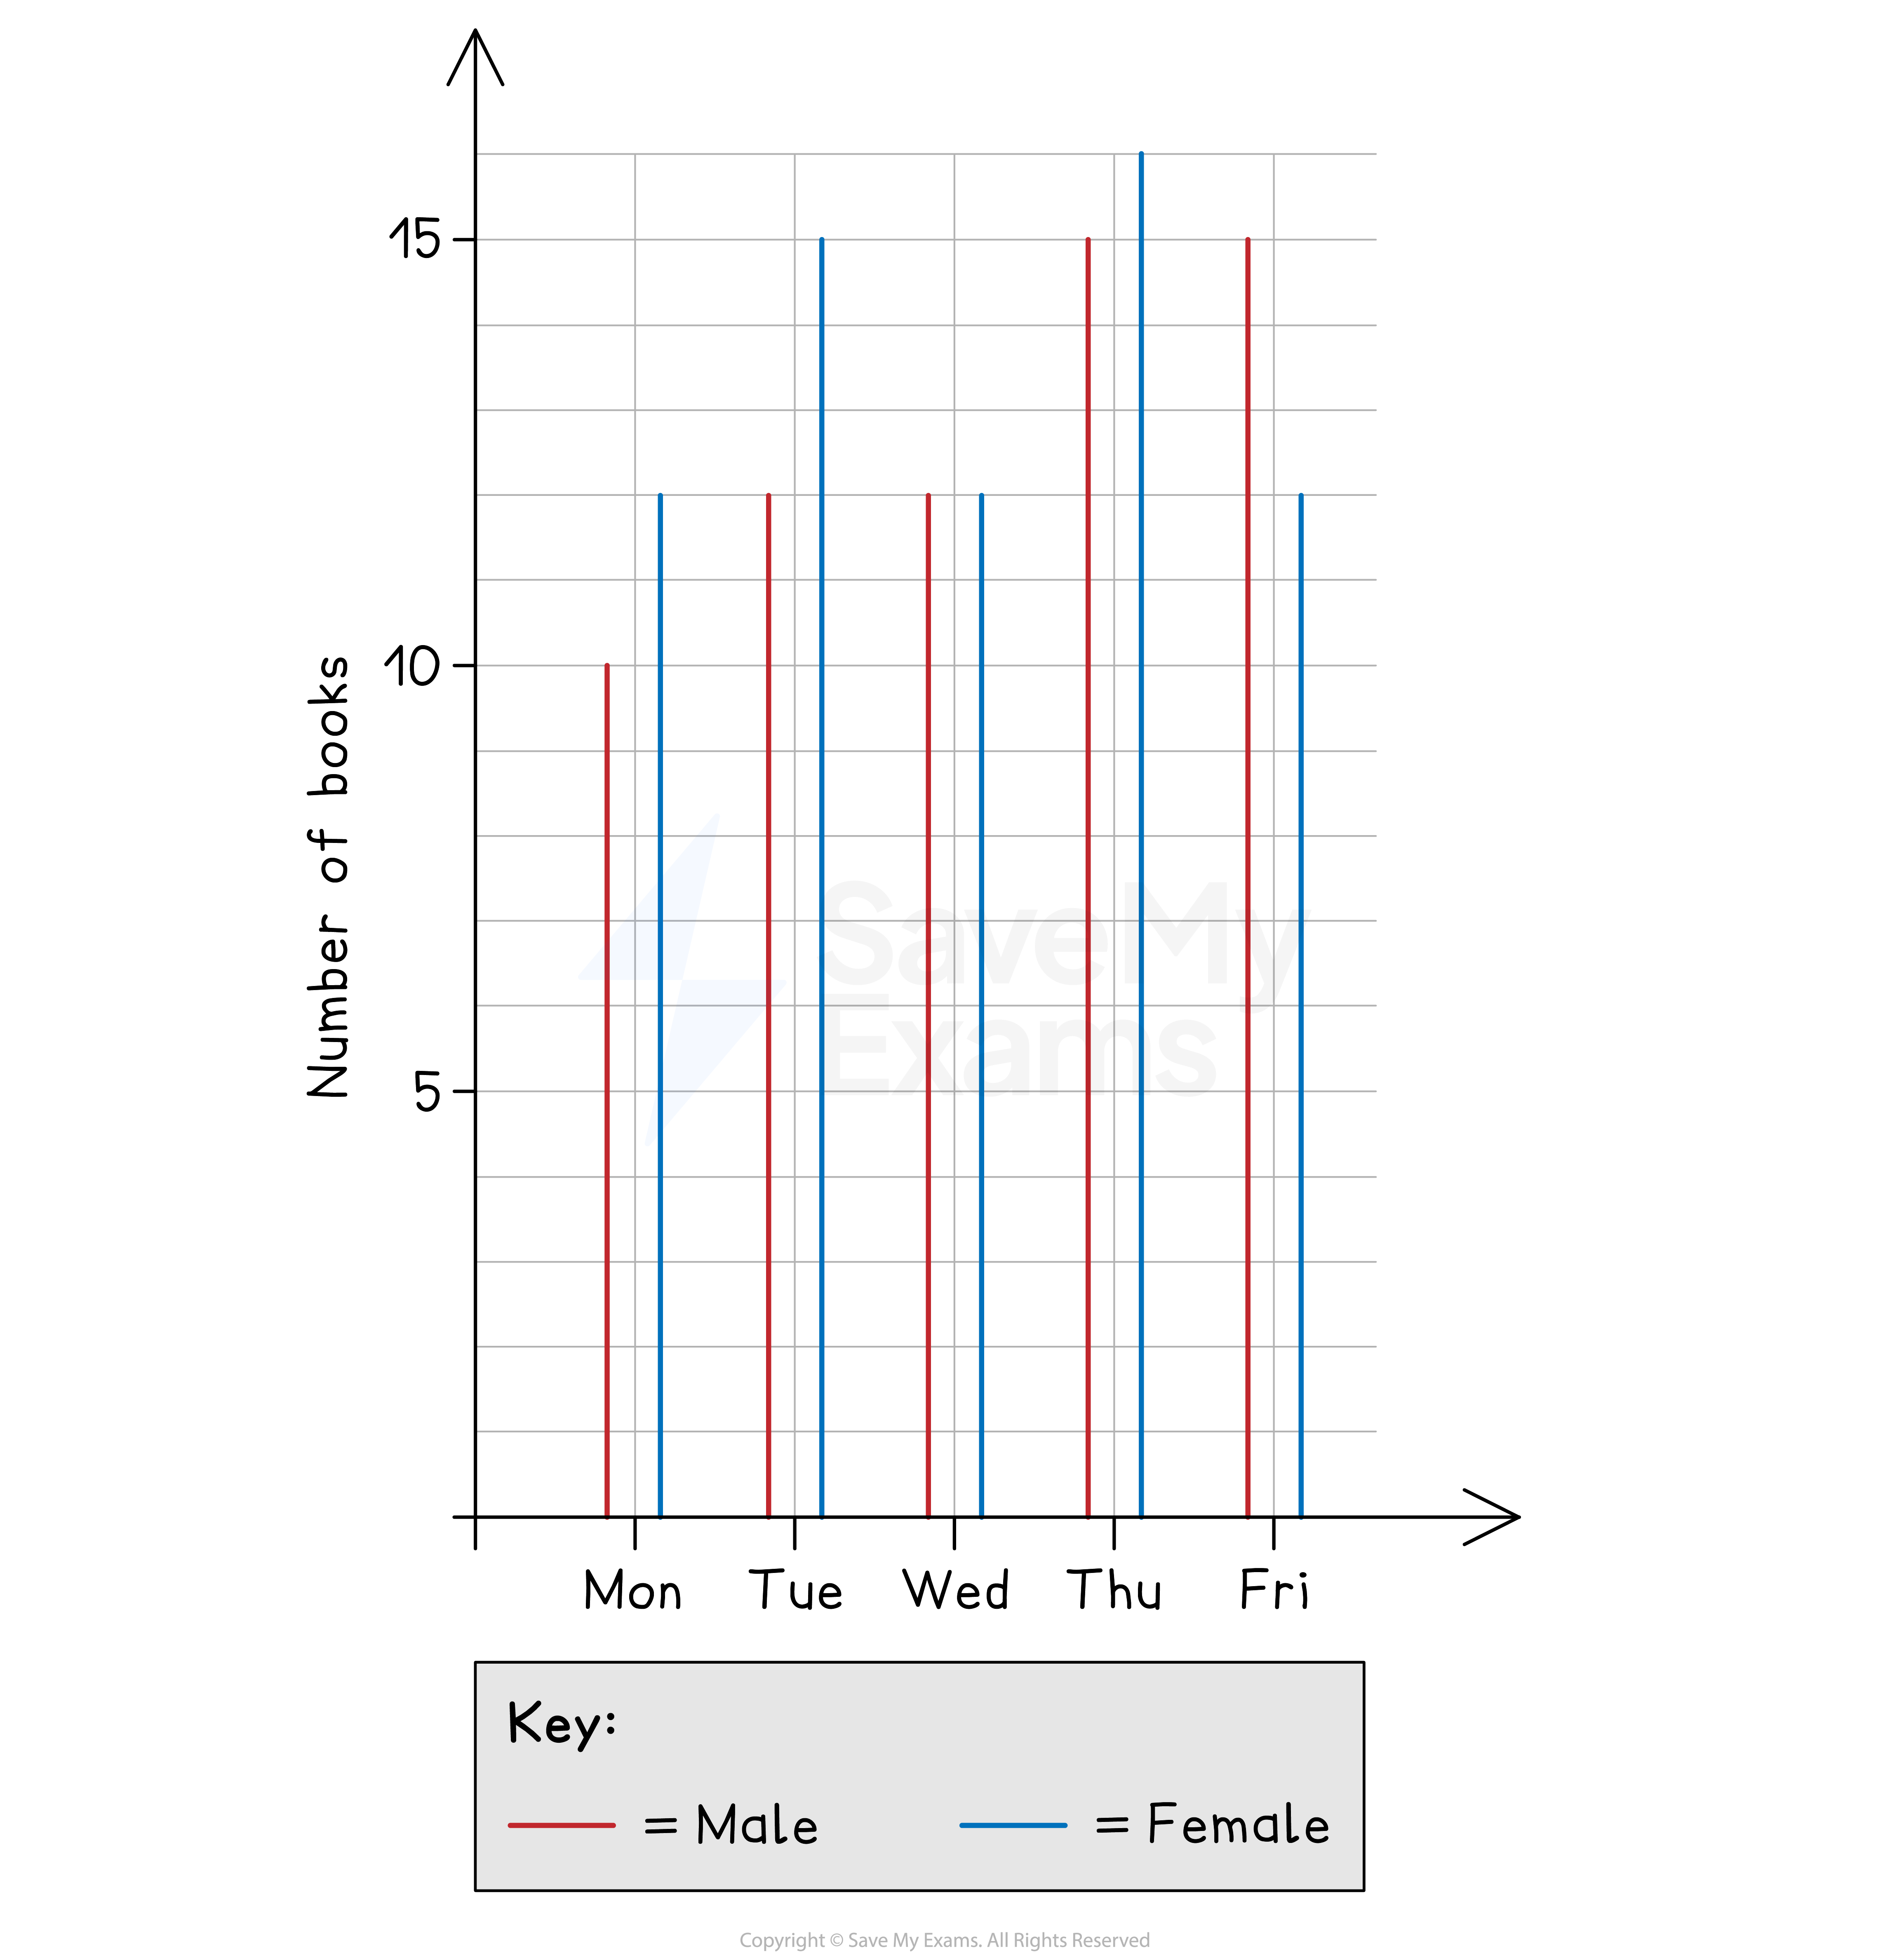
The number of books bought during the opening week of a new bookshop is shown below.
The shopkeeper wants to investigate shopping patterns between male and female customers.
(a) Briefly summarise the overall trend in the number of books bought by male customers.
Answer:
Look at the heights of the red lines
Comment on how they increase ('briefly' means you do not have to talk about every point)
Use numbers from the graph and exact phrases from the question
The number of books bought by male customers increases
from 10 on Monday up to 15 on both Thursday and Friday
(b) The shopkeeper says that the changes in the blue lines suggest that the amount of books bought by females varies more than males.
By comparing a suitable statistical measure, show that this is not necessarily true.
Answer:
Variations refers to the spread of data, so compare their ranges
For male and female, subtract the smallest value from the biggest value
Male range is 15 - 10 = 5
Female range is 16 - 12 = 4
Compare the numbers
Explain how this relates to the spread of the data
State how your findings do not agree with the shopkeeper
The range of male customers is greater than that of female customers, 5 > 4
This suggests male customers have a greater spread (variability) in books bought
This is the opposite of what the shopkeeper said
(c) Give one reason as to why the shopkeeper should not use the data shown to draw conclusions about shopping patterns.
Answer:
Reread the sentences at the beginning
This data is for the opening week of the bookshop only
State that this is unrepresentative of a normal week
Give a specific real life example
The data shown is for the opening week of the bookshop
It is unlikely to be representative of a normal week
The numbers may increase as the bookshop becomes more popular