The table below and the corresponding histogram show the weight, in kg, of some new born bottlenose dolphins.
Weight
w kg | Frequency |
4 ≤ w < 8 | 4 |
8 ≤ w < 10 | 16 |
10 ≤ w < 12 | 19 |
12 ≤ w < 15 | 12 |
15 ≤ w < 30 | |
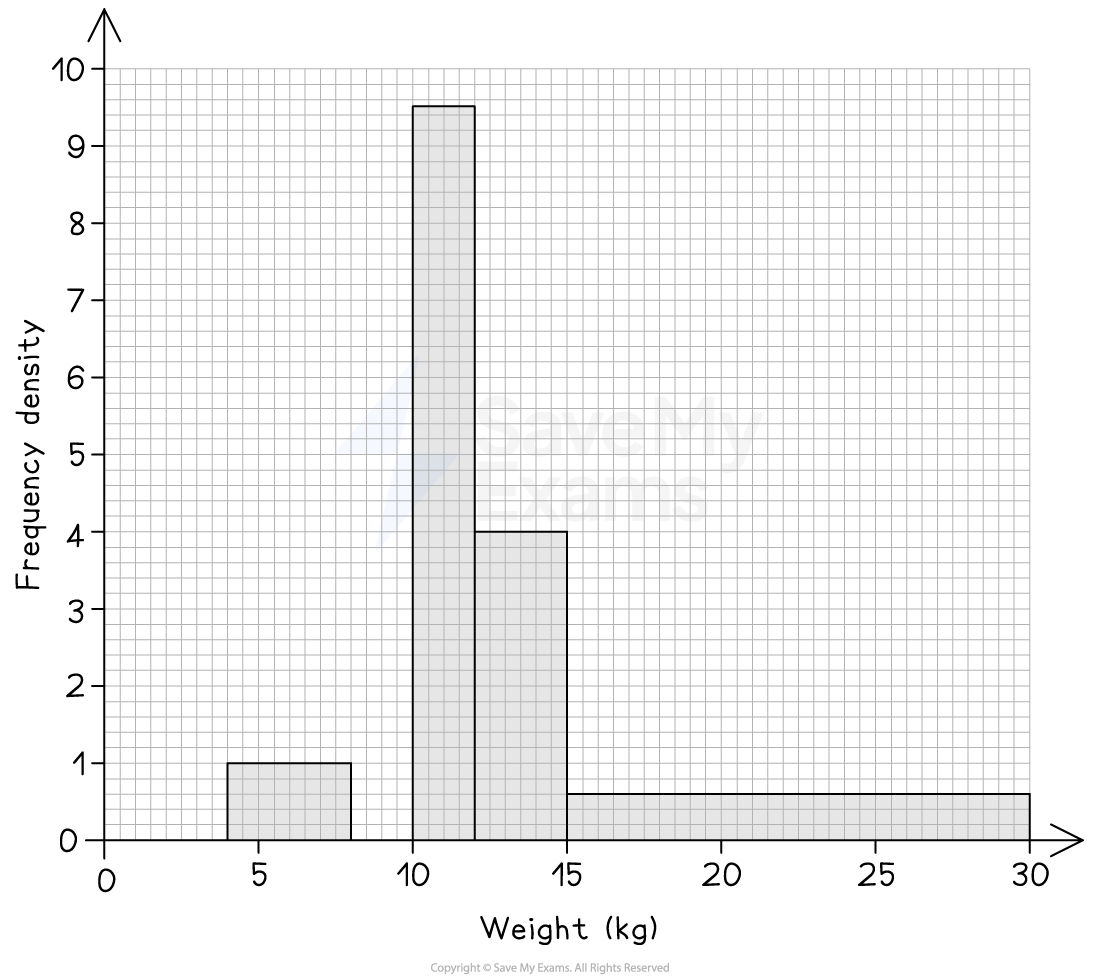
(a) Use the histogram to complete the table.
Answer:
The frequency for the 15 ≤ w < 30 class interval is missing
The bar for that class interval on the histogram has a
Rearrange to get
Weight
w kg | Frequency |
4 ≤ w < 8 | 4 |
8 ≤ w < 10 | 16 |
10 ≤ w < 12 | 19 |
12 ≤ w < 15 | 12 |
15 ≤ w < 30 | 9 |
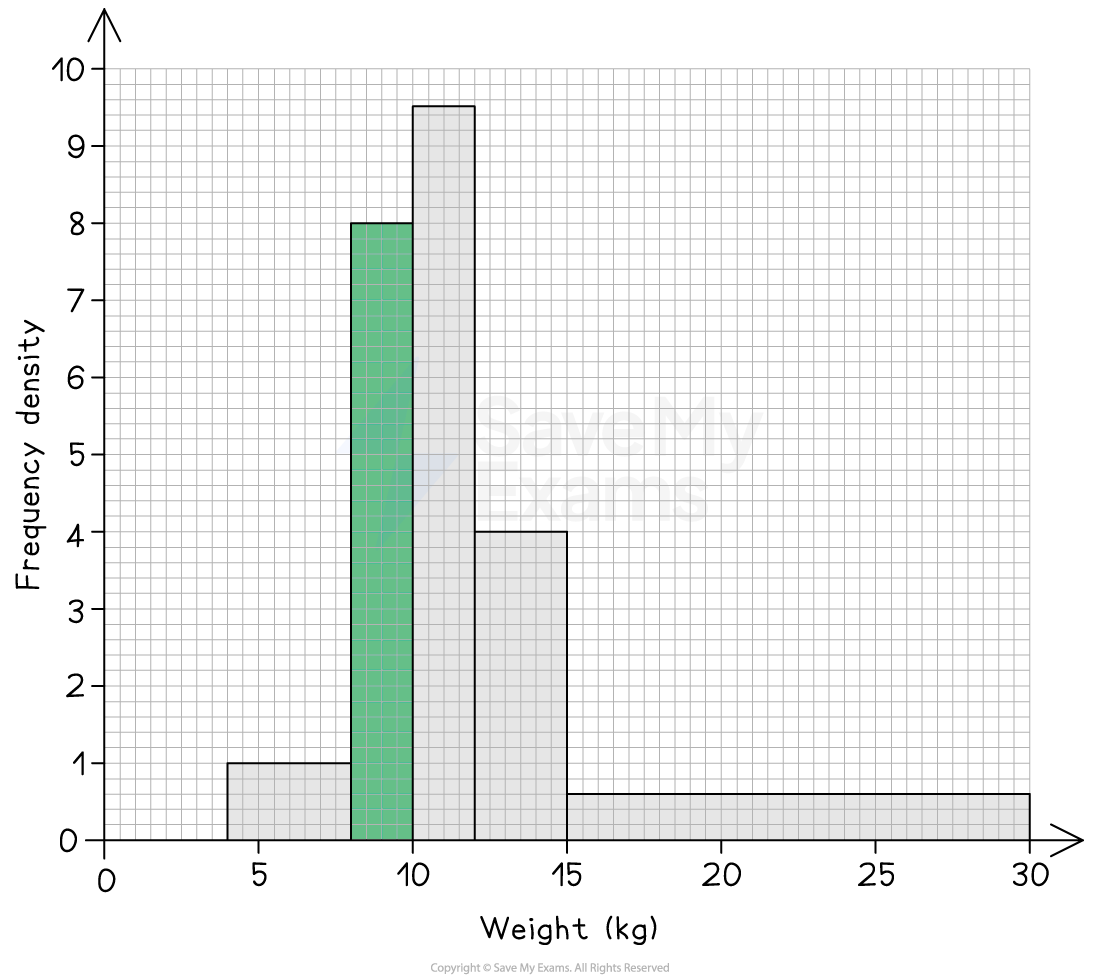
(b) Use the table to complete the histogram.
Answer:
The bar for the 8 ≤ w < 10 class interval is missing
That class interval has a
frequency of 16
width of 10-8 = 2
Use to find the frequency density
Draw a bar with that height on the histogram, between 8 and 10 on the horizontal axis
(c) Estimate the number of dolphins whose weight is greater than 13 kg.
Answer:
We know from part a) that there are 9 dolphins in the 15 ≤ w < 30 class interval
So we need to estimate the number of dolphins that are in the interval 13 ≤ w < 15
For 13 ≤ w < 15, the histogram shows that
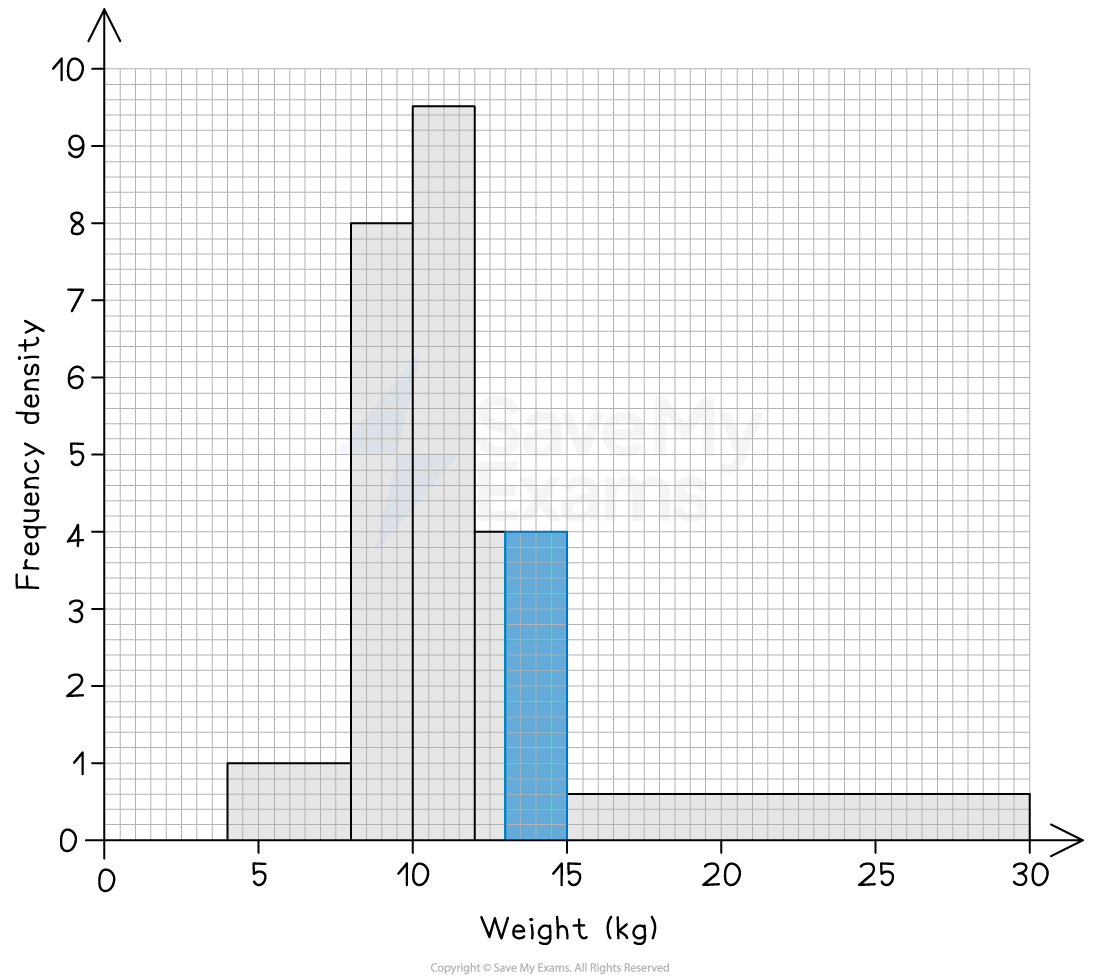
Now use to estimate the number of dolphins in the 13 ≤ w < 15 interval
(Note that using the histogram in this way is actually a form of linear interpolation)
This is only an estimate because we don't actually know that dolphins are evenly distributed across the entire 12 ≤ w < 15 class interval
Now the total number of dolphins with a weight greater than 13 kg can be estimated
There are approximately 17 dolphins with a weight greater than 13 kg