The Five Macroeconomic Aims
Economic Growth
Economic Growth
Economic growth is a central macroeconomic aim of most governments
Many developed nations have an annual target growth rate of 2-3%
This is considered to be sustainable growth
Growth at this rate is less likely to cause excessive demand pull inflation
Politicians often use it as a metric of the effectiveness of their policies and leadership
Economic growth has positive impacts on confidence, consumption, investment, employment, incomes, living standards and government budgets
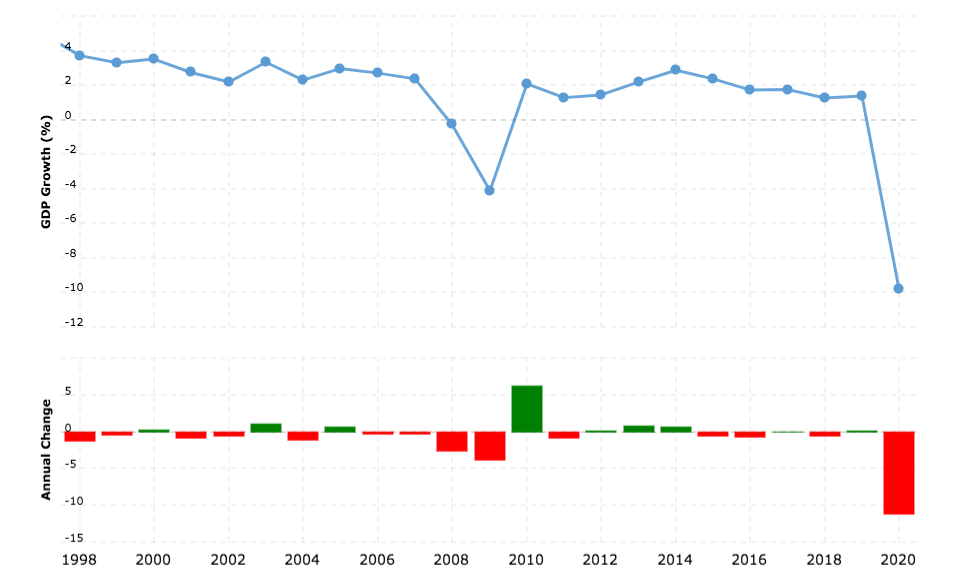
A Table Highlighting Some of the Economic Growth Trends in the UK Since 1998
1998-2007 | 2008-2015 | 2016-2019 | 2020 - |
|---|---|---|---|
|
|
|
|
Low Unemployment
Low Unemployment
Someone is considered to be unemployed if they do not have a job and are actively seeking for one
The target unemployment rate often depends on the size of the economy e.g. India finds a rate of 6.5% good whereas Singapore aims for it to be under 2%
The closer an economy is to the full employment level of labour, the better (more efficiently) it is using its human resources
Within the broader unemployment rate, there is an increased emphasis on the unemployment rate within different sections of the population
E.g. Youth unemployment, ethnic/racial unemployment by group
In 2021, black unemployment in the USA was 8.7% and white unemployment was 4.7%
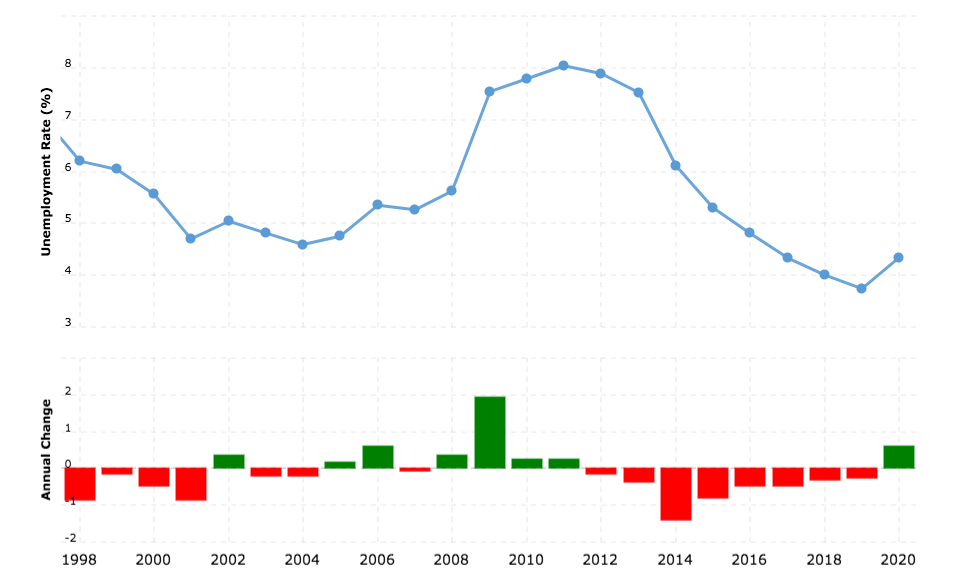
Unemployment tends to be inversely proportional to real GDP growth
When real GDP increases, unemployment falls
When real GDP decreases, unemployment rises
Unemployment in the UK remained relatively high for the six years following the global financial crisis of 2007
Low and Stable Rate of Inflation
Low and Stable Rate of Inflation
Most economies have a target inflation rate of 2% using the Consumer Price Index (CPI)
A low rate of inflation is desirable as it is a symptom of economic growth
The different causes of inflation (cost push or demand pull) require different policy responses from the Government
Demand-side policies ease demand pull inflation
Supply-side policies ease cost push inflation
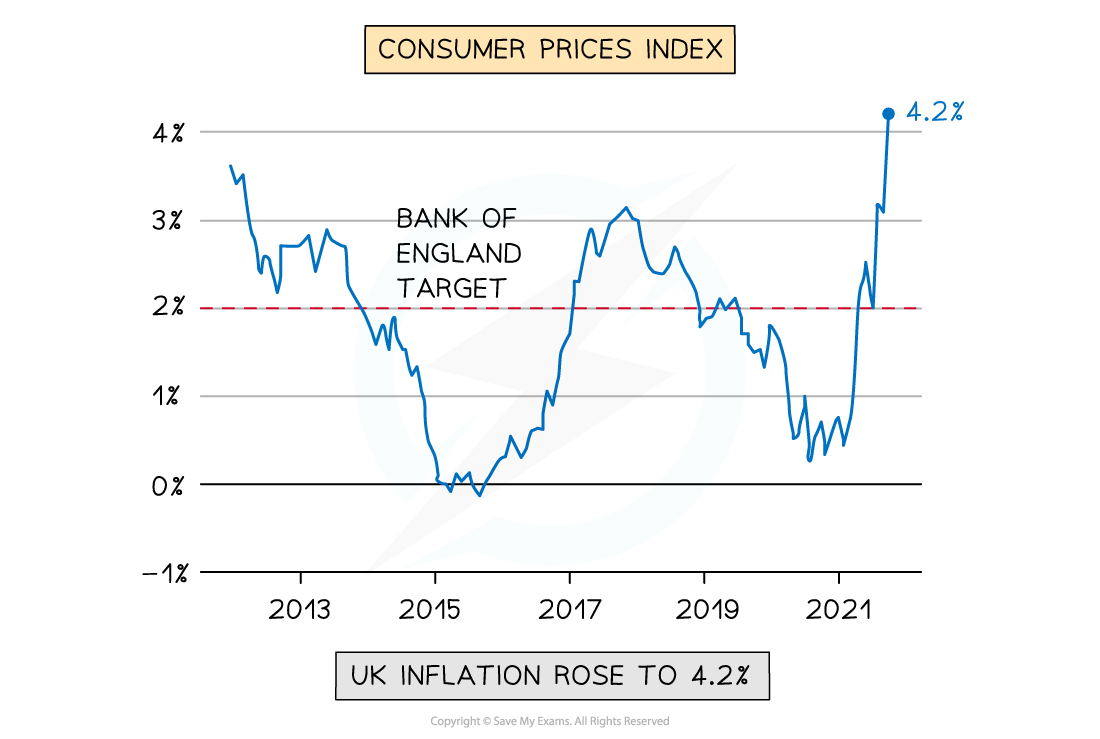
In the UK, a continual deviation from the target of 2% would not be considered as stable
An inflation rate in April 2022 of 4-5% was considered to be unstable, eroding household purchasing power
A low and stable rate of inflation is important as it
Allows firms to confidently plan for future investment
Offers price stability to consumers
Balance of Payments Stability on the Current Account
Balance of Payments Stability on the Current Account
The Balance of Payments (BoP) for a country is a record of all the financial transactions that occur between it and the rest of the world
The current account focuses mainly on the financial transactions related to exports and imports of goods/services
Governments aim for Balance of Payments equilibrium on the Current Account
If exports > imports it will create a current account surplus
If imports > exports, it will create a current account deficit
Each one of these conditions has advantages/disadvantages associated with it
However, a current account deficit is more problematic in the long-run
The UK has traditionally run a small deficit
As a % of GDP the UK current account deficit is insignificant so has not been problematic
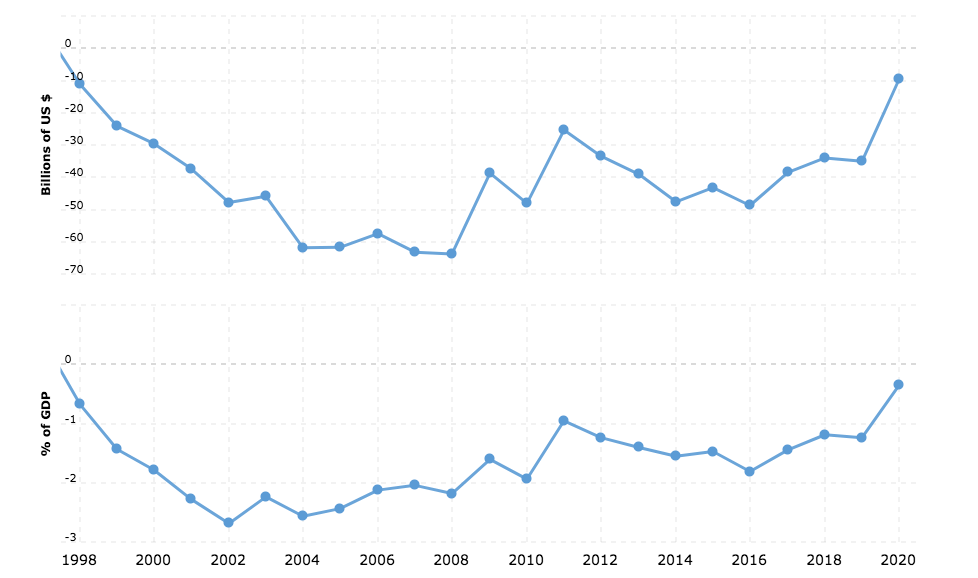
In the diagram above the trade deficit has been falling steadily since 2016
During this time period the value of exports was increasing slightly faster than the value of imports
The Redistribution of Income
The Redistribution of Income
The redistribution of income aims to reduce income inequality in an economy
High levels of income inequality create social unrest and can ultimately lead to revolutions
Perfect income equality is not desirable as it removes the incentive to work and study
Governments aim to redistribute income by taxing the wealthy and providing welfare payments to the poor
Unchecked capitalism has a natural outcome of high income inequality
The wealthy are able to keep buying factors of production
The concentration of ownership becomes more and more narrow with fewer individuals owning the bulk of the world's wealth
There is a need for governments to intervene to maintain acceptable levels of income inequality
Absolute poverty is usually worse in developing countries. However, in a developed economy such as Germany, a 1% increase in income inequality can push a lot more households into relative poverty