Population Growth & Decline
Specification link
This page covers section 6.1.1 and 6.1.2 of the CIE O Level specification.
6.1.1 -Patterns and trends in global population growth.
6.1.2 - Reasons for the growth and decline of a country’s population: fertility rate, birth rate, death rate, natural increase, migration.
Patterns and trends in population change
Patterns and trends in population change
Nearly 80 million people are added to the world's population each year
Population growth was steady and low until 1804, when the world population reached 1 billion
After 1804, it took just over 100 years for the population to double to 2 billion
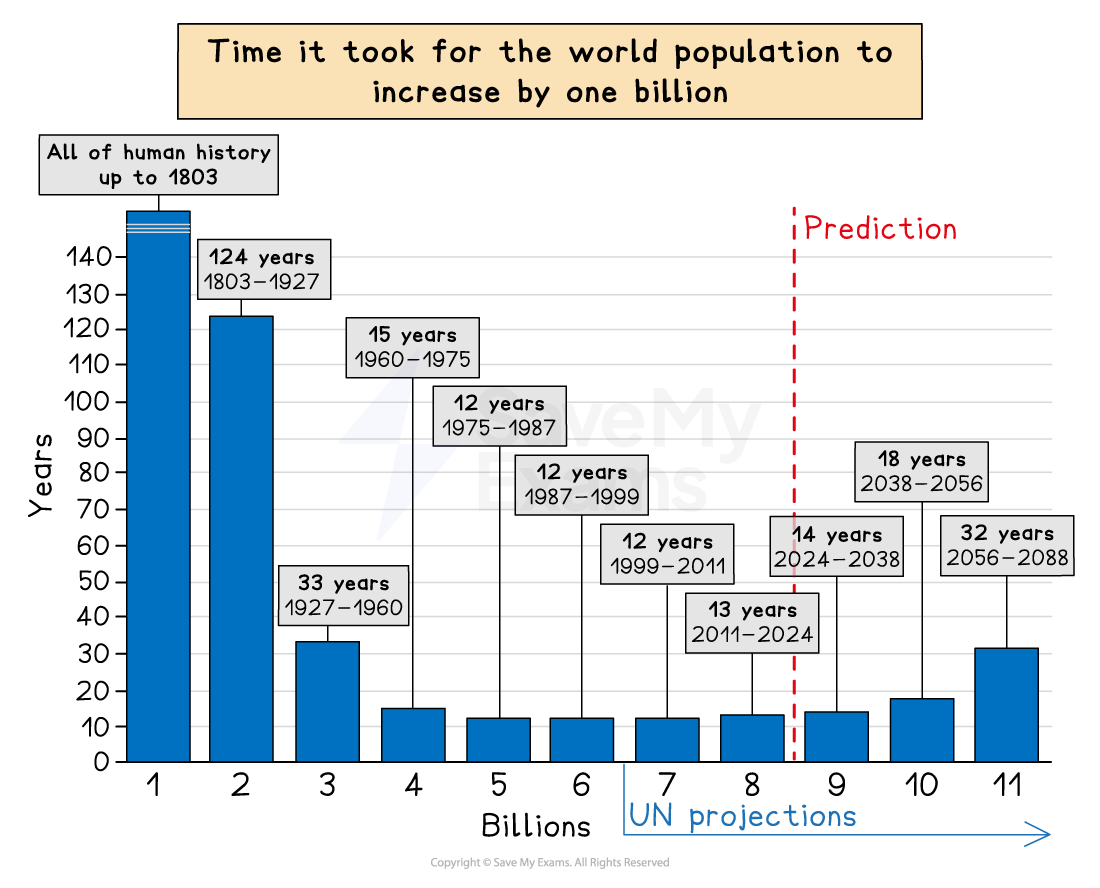
The rate of increase after 1930 was more rapid and led to a population explosion
The fastest increase in population happened during the 1980s and 1990s
Population growth rate is the average annual change of the population size during a set period of time, usually a year
The population is still increasing but at a slower rate
In 1970, the growth rate was 2%
In 2022, the growth rate is under 1%
It is predicted by the UN that the population will stabilise at around 11 billion in 2100
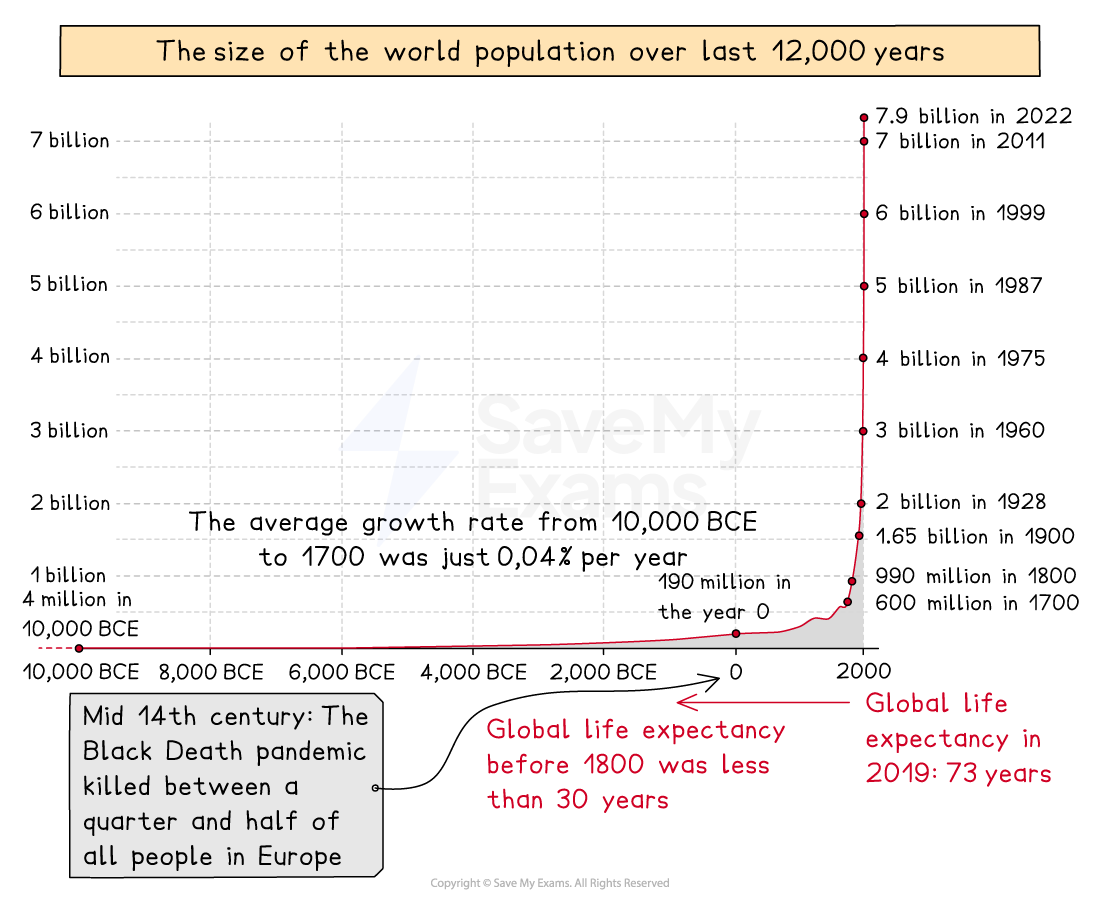
This rapid global population increase has been caused by a combination of numerous factors, including improvements in
agriculture, particularly during the agricultural revolution, led to higher yields and more varied diets
medicine and medical care, which reduces the death rate
technology and transport led to a wealthier population, which increased life expectancy
clean water supply and sewage disposal leading to a reduction in disease
All these factors also led to a decrease in the death rate
The birth rate has remained high mainly in low-income countries (LICs) due to:
lack of access to family planning and contraception
an increase in women surviving childbirth
families continuing to have large numbers of children to look after their parents in old age and to help support the family
the culture of having larger families, which takes many years to change
religious reasons
Reasons for the growth and decline of population
Reasons for the growth and decline of population
Population Change
There are two ways in which a population can change:
Migration
Natural population change
Migration
Migration can cause the population to either increase or decrease
This occurs as the result of emigration or immigration
Net migration is the difference between the number of people moving into a country (immigrants) and the number of people leaving the country (emigrants)
Both LICs and high income countries (HICs) experience migration
Most emigration is from LICs
Most immigration is to HICs
Natural population change
Natural population change occurs due to changes in the birth rates and death rates
Natural change in population is calculated by subtracting the death rate from the birth rate
The combination of a decreasing death rate and high birth rate led to rapid natural increase and population explosion
A negative rate of natural increase happens when the birth rate is lower than the death rate
Birth rate
The birth rate is the number of live babies born per 1000 people
This figure is calculated by:
dividing the total number of births by the total population and multiplying by 1000
In HICs, the birth rate tends to be low whereas in LICs the birth rate tends to be high
Fertility rate
Fertility rate is the number of live births per 1000 women aged 15-49 years in a given year
These rates apply to women within the main reproductive age range of 15-49 years (some sources use 15-44 years), rather than to the whole population
This makes for a more accurate measure of fertility than just the birth rate
Total fertility rate (TFR) is:
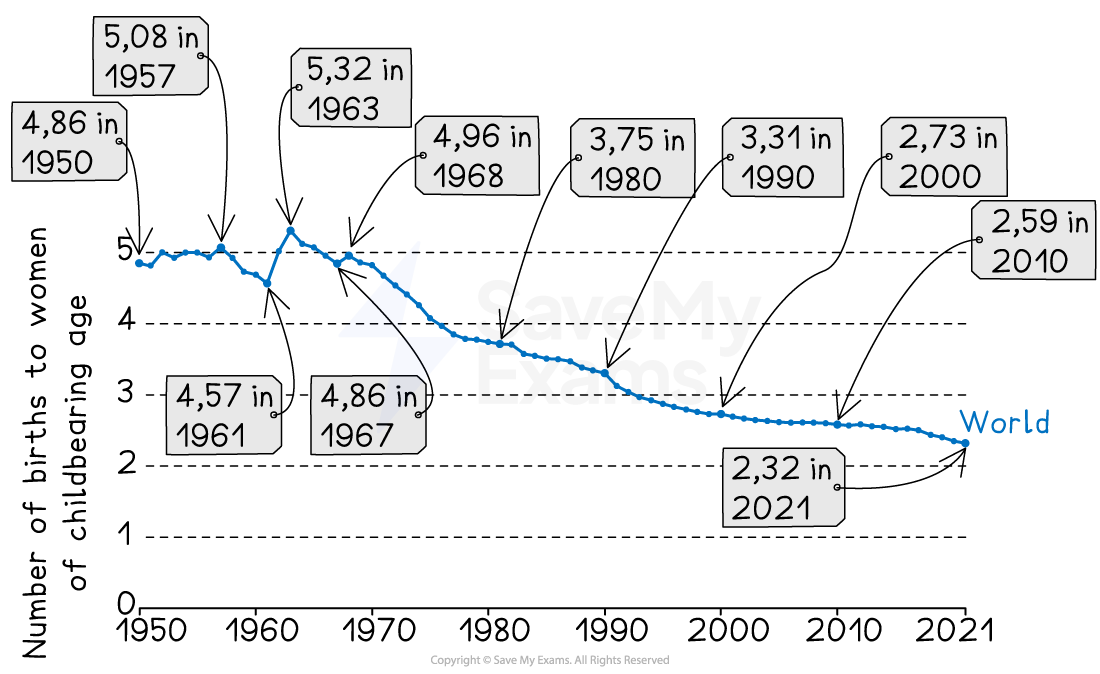
The average number of children that would be born alive to a woman during her lifetime – total family size
The global fertility rate has fallen rapidly since 1950
Death rate
The death rate is the number of deaths per 1000 people
This figure is calculated by:
dividing the total number of deaths by the total population and multiplying by 1000
In HICs, the death rate tends to be low whereas in LICs the death rate tends to be high