The Demographic Transition Model
Specification link
This page covers section 6.1.4 of the CIE O Level specification.
6.1.4 - The demographic transition model (DTM) and its strengths and limitations.
What is the demographic transition model?
What is the demographic transition model?
The demographic transition model (DTM) shows the five generalised stages of population change that countries pass through as they develop
It shows how birth and death rates change over time and how this affects the overall population as the country
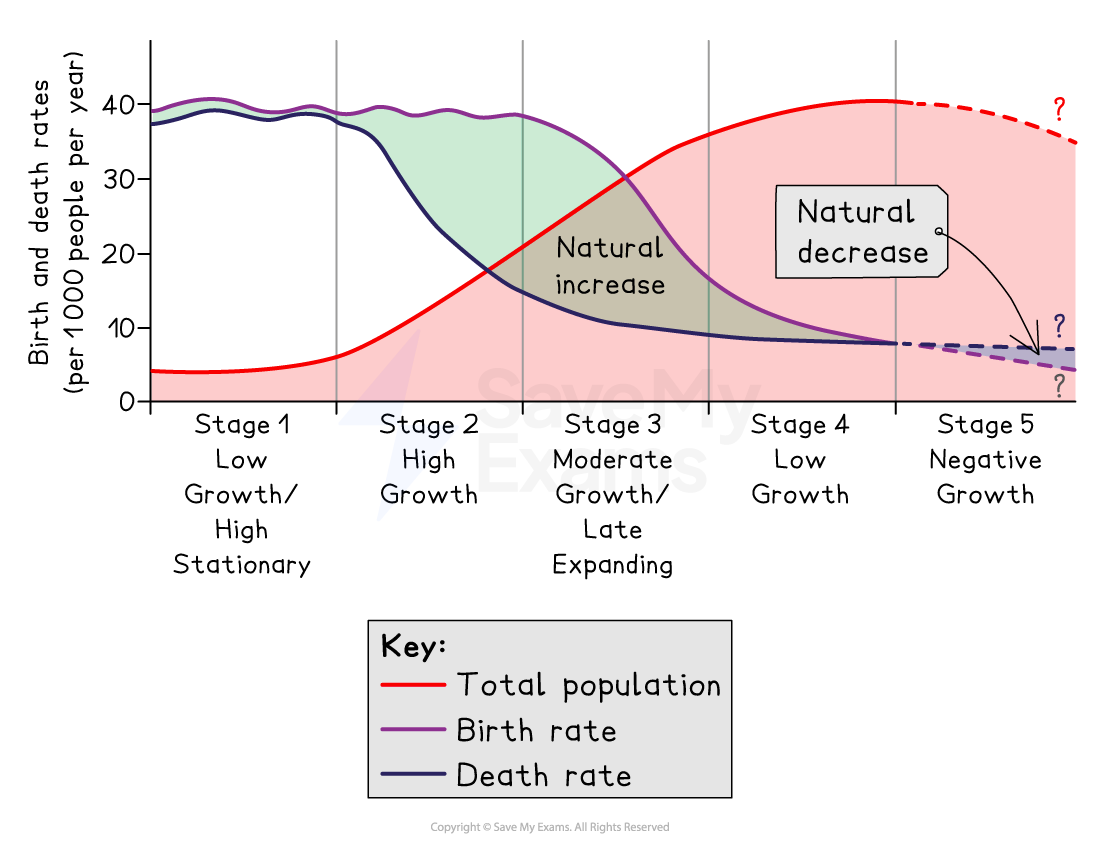
Stages of the demographic transition model
Stage 1
The total population is low
High birth rates due to lack of contraception/family planning
High death rates due to:
poor healthcare
poor diet
famine
High infant mortality leads people to have more children so that some children survive to adulthood
Stage 2
The total population starts to rise rapidly
Birth rates remain high as people continue to have large families because:
children are needed as workers
no pensions or elderly care means people have children to look after them in their old age
Death rates decrease as a result of:
improved diets
better healthcare
lower infant mortality
increased access to clean water
Stage 3
The total population continues to increase but the rate of growth begins to slow
The birth rate begins to fall rapidly due to:
increased birth control
family planning
increased cost of raising children
low infant mortality rate
more access to education for women
The death rate is still decreasing, but at a slower rate, as there have been improvements in:
medicine
hygiene
diet
water quality
Stage 4
The total population is high and is increasing slowly
The low and fluctuating birth rate can be attributed to
accessible birth control and the choice of having fewer children
women delaying the age they start to have children
The death rate is low and fluctuates
Stage 5
The total population starts to slowly decline as the death rate exceeds the birth rate
The birth rate is low and slowly decreasing
The death rate is low and fluctuates
Strengths of the demographic transition model
Strengths of the demographic transition model
The DTM simplifies population change, making the trends easy to identify and analyse
It can be easily applied to different settings
The DTM shows what happened to the population in Western Europe before, during and after industrialisation
It can help governments plan for predicted future changes
Limitations of the demographic transition model
Limitations of the demographic transition model
The DTM does not take into account migration, natural disasters, pandemics, wars or government policies that impact birth rates, e.g. China’s one-child policy
It is based on countries in Western Europe that industrialised between 1800 and 1950
So it is harder to apply to MICs and LICs today that are industrialising in shorter time-frames due to globalisation
The model assumes that all countries will develop in the same way