Solving Equations from Graphs
Solving Equations Using Graphsvideo
Solving equations using graphs
How do I find the coordinates of points of intersection?
Plot two graphs on the same set of axes
The points of intersection are where the two lines meet
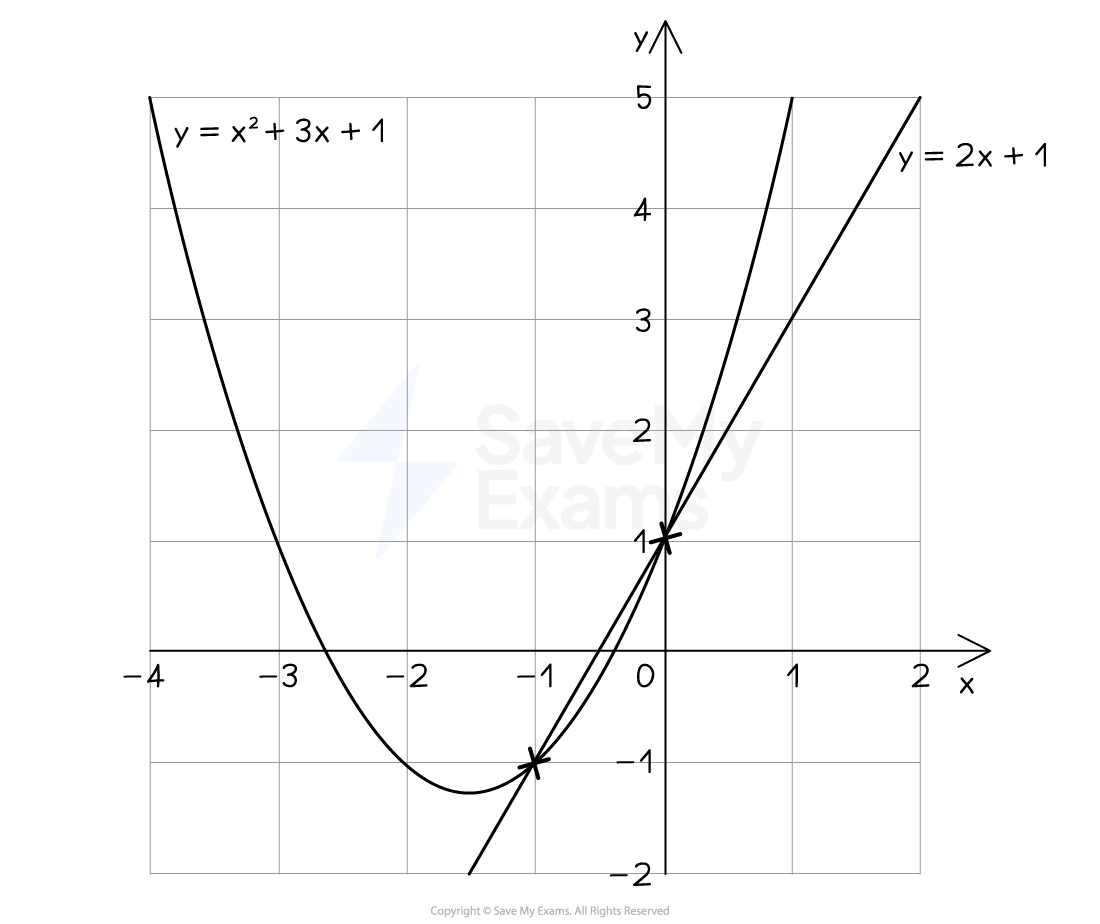
For example, plot y = x2 + 3x + 1 and y = 2x + 1 on the same axes
They meet twice, as shown
The coordinates of intersection are (-1, -1) and (0, 1)
How do I solve simultaneous equations graphically?
The x and y solutions to simultaneous equations are the x and y coordinates of the point of intersection
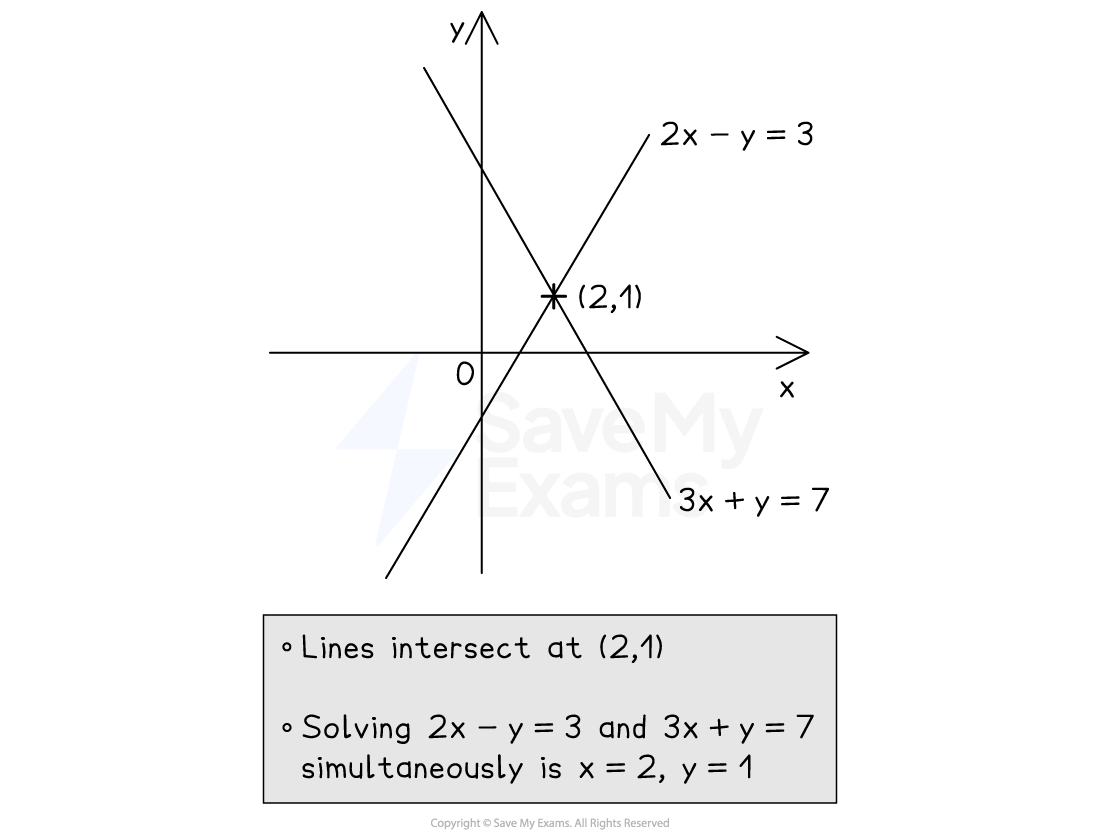
For example, to solve 2x - y = 3 and 3x + y = 7 simultaneously
Rearrange them into the form y = mx + c
y = 2x - 3 and y = -3x + 7
Use a table of values to plot each line
Find the point of intersection, (2, 1)
The solutions are therefore x = 2 and y = 1
How do I use graphs to solve equations?
This is easiest explained through an example
You can use the graph of to solve the following equations
The solutions are the two x-intercepts
This is where the curve cuts the x-axis (also called roots)
The solutions are the two x-coordinates where the curve intersects the horizontal line
The solutions are the two x-coordinates where the curve intersects the straight line
The straight line must be plotted on the same axes first
To solve a different equation like , if you are already given the graph of an equation, e.g.
add / subtract terms to both sides to get "given graph = ..."
For example, subtract 5 from both sides
You can now draw on the horizontal line and find the x-coordinates of the points of intersection