Speed-Time Graphs
Speed-Time Graphsvideo
Speed-time graphs
How do I use a speed-time graph?
Kinematics is the study of motion of objects
It looks at how an object moves over time
Speed-time graphs show the speed of an object at different times
Speed is on the vertical axis
Time is on the horizontal axis
The gradient of the graph is the acceleration
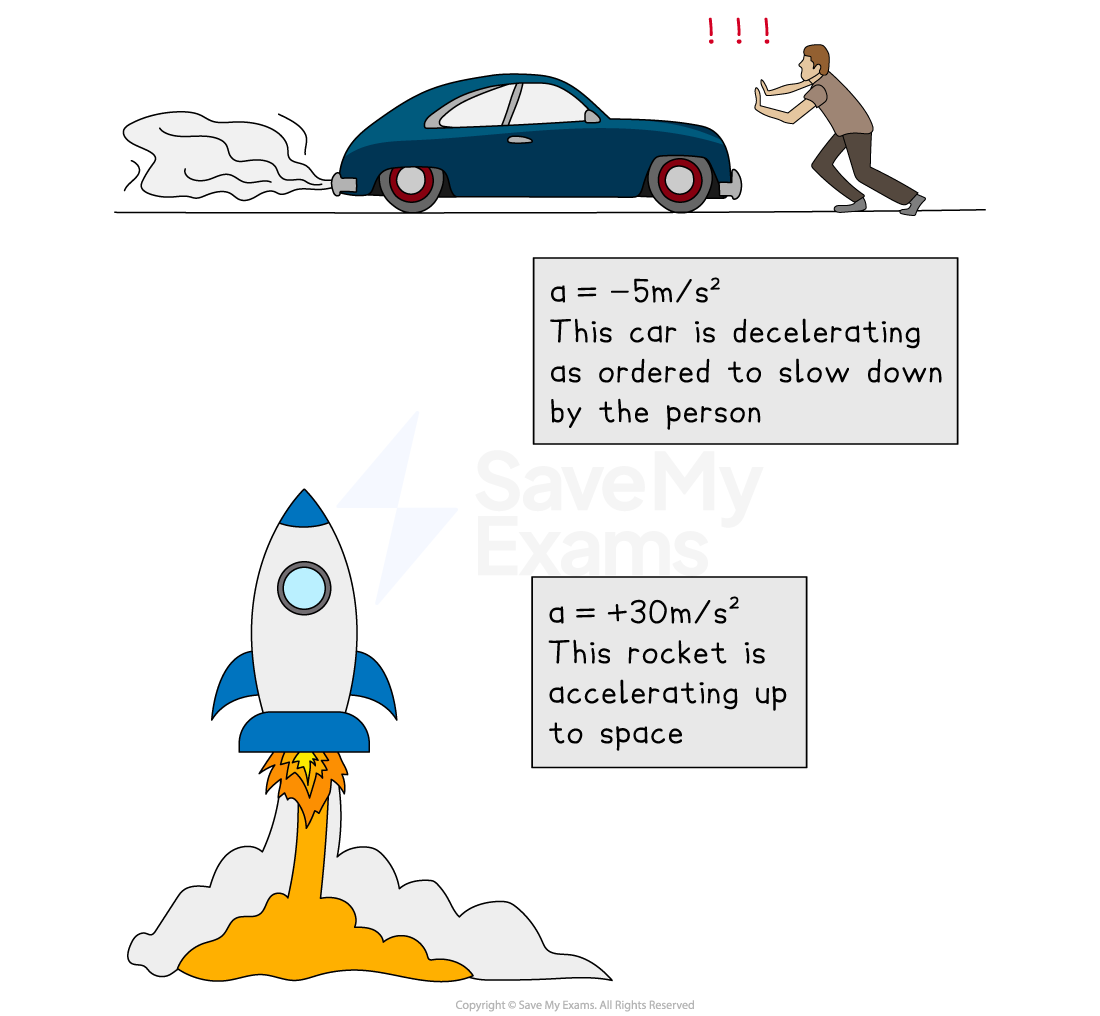
A positive gradient shows positive acceleration (speeding up)
A negative gradient shows negative acceleration, (slowing down)
This is also called deceleration
Horizontal lines indicate moving at a constant speed
The object is neither speeding up or slowing down
If the constant speed is zero, then it is at rest
A straight line shows constant acceleration
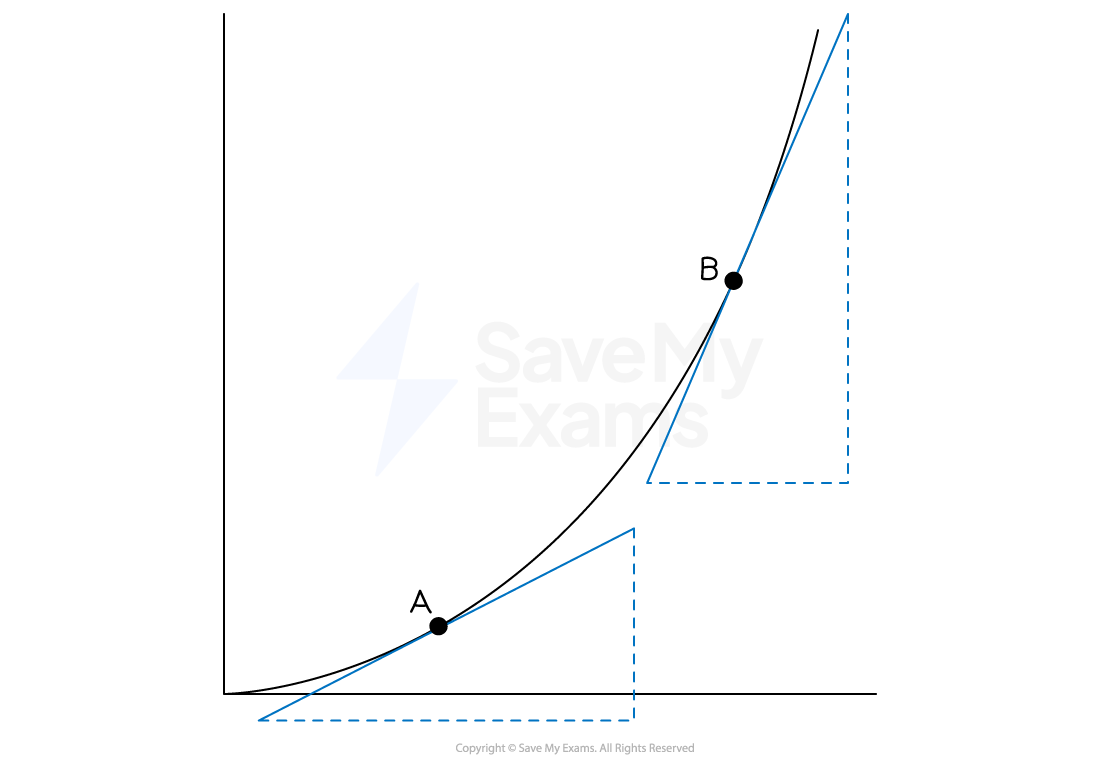
A curve shows changing acceleration
To find the acceleration at a particular point on the graph
draw a tangent to the graph at this point and find its gradient
The distance covered by the object is the area under the graph
Split the area into simple shapes, e.g. rectangles and triangles
Find the area of each shape and add them together