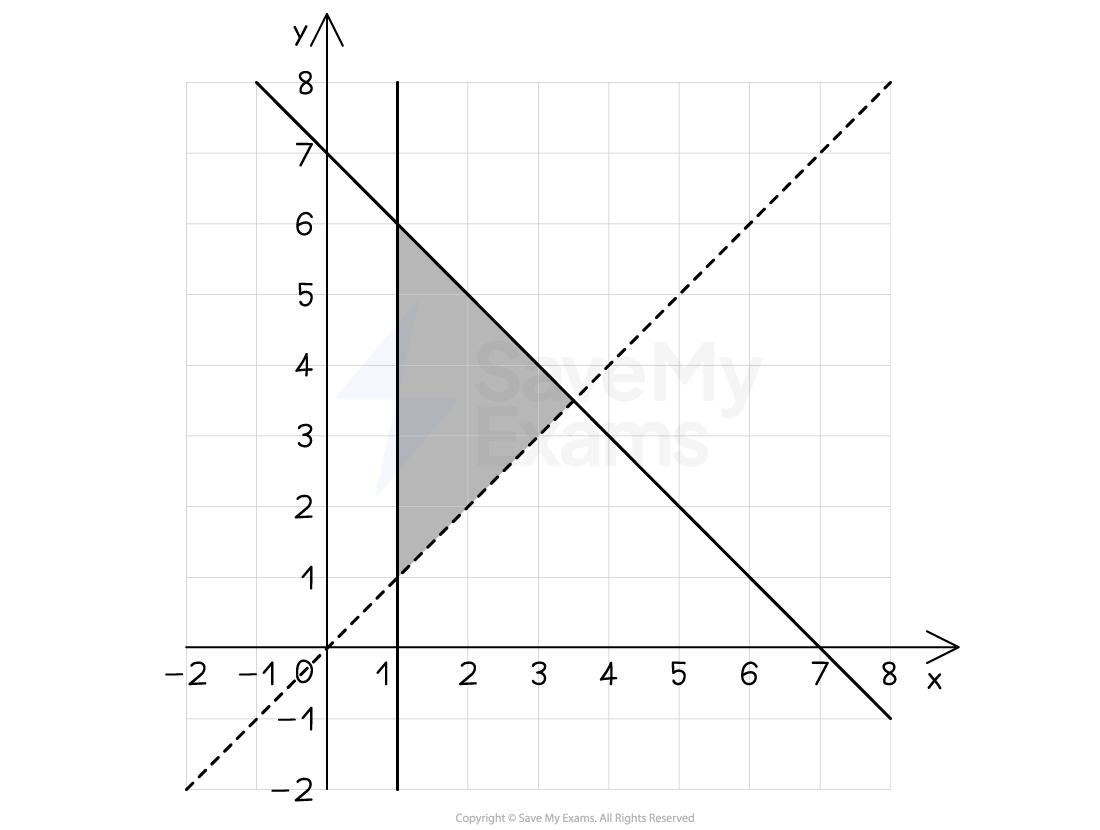
Write down the three inequalities which define the shaded region shown on the axes below.
Answer:
Find the equations of the three lines shown (ignoring inequality signs for now)
You may be able to see the lines and
The other line has the form with y-intercept 7 and gradient -1
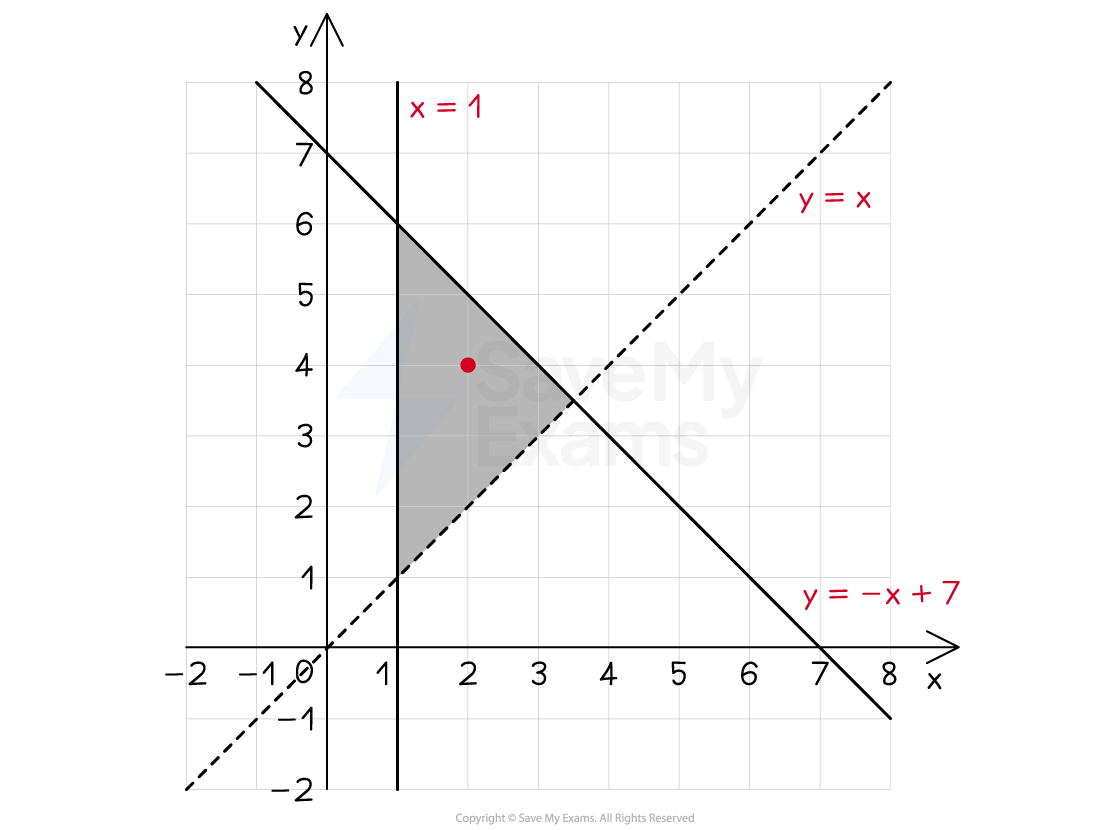
Now decide which inequality signs to use
For , the shaded region is above the line, and the line is dotted, so the inequality is
If unsure, check by substituting in coordinates from the shaded region
For example, using (2, 4) as marked on the graph above
"" is true, so the inequality is correct
For , the shaded region is below the line, and the line is solid, so the inequality is
Again, check by substituting (2, 4) into the inequality
"" is true, so the inequality is correct
For , the shaded region is to the right of the solid line so the inequality is
Write all three inequalities together as your final answer
, and