One afternoon, Mary jogged 8 km from her home to her grandfather's house.
Part of the travel graph for her journey is shown.
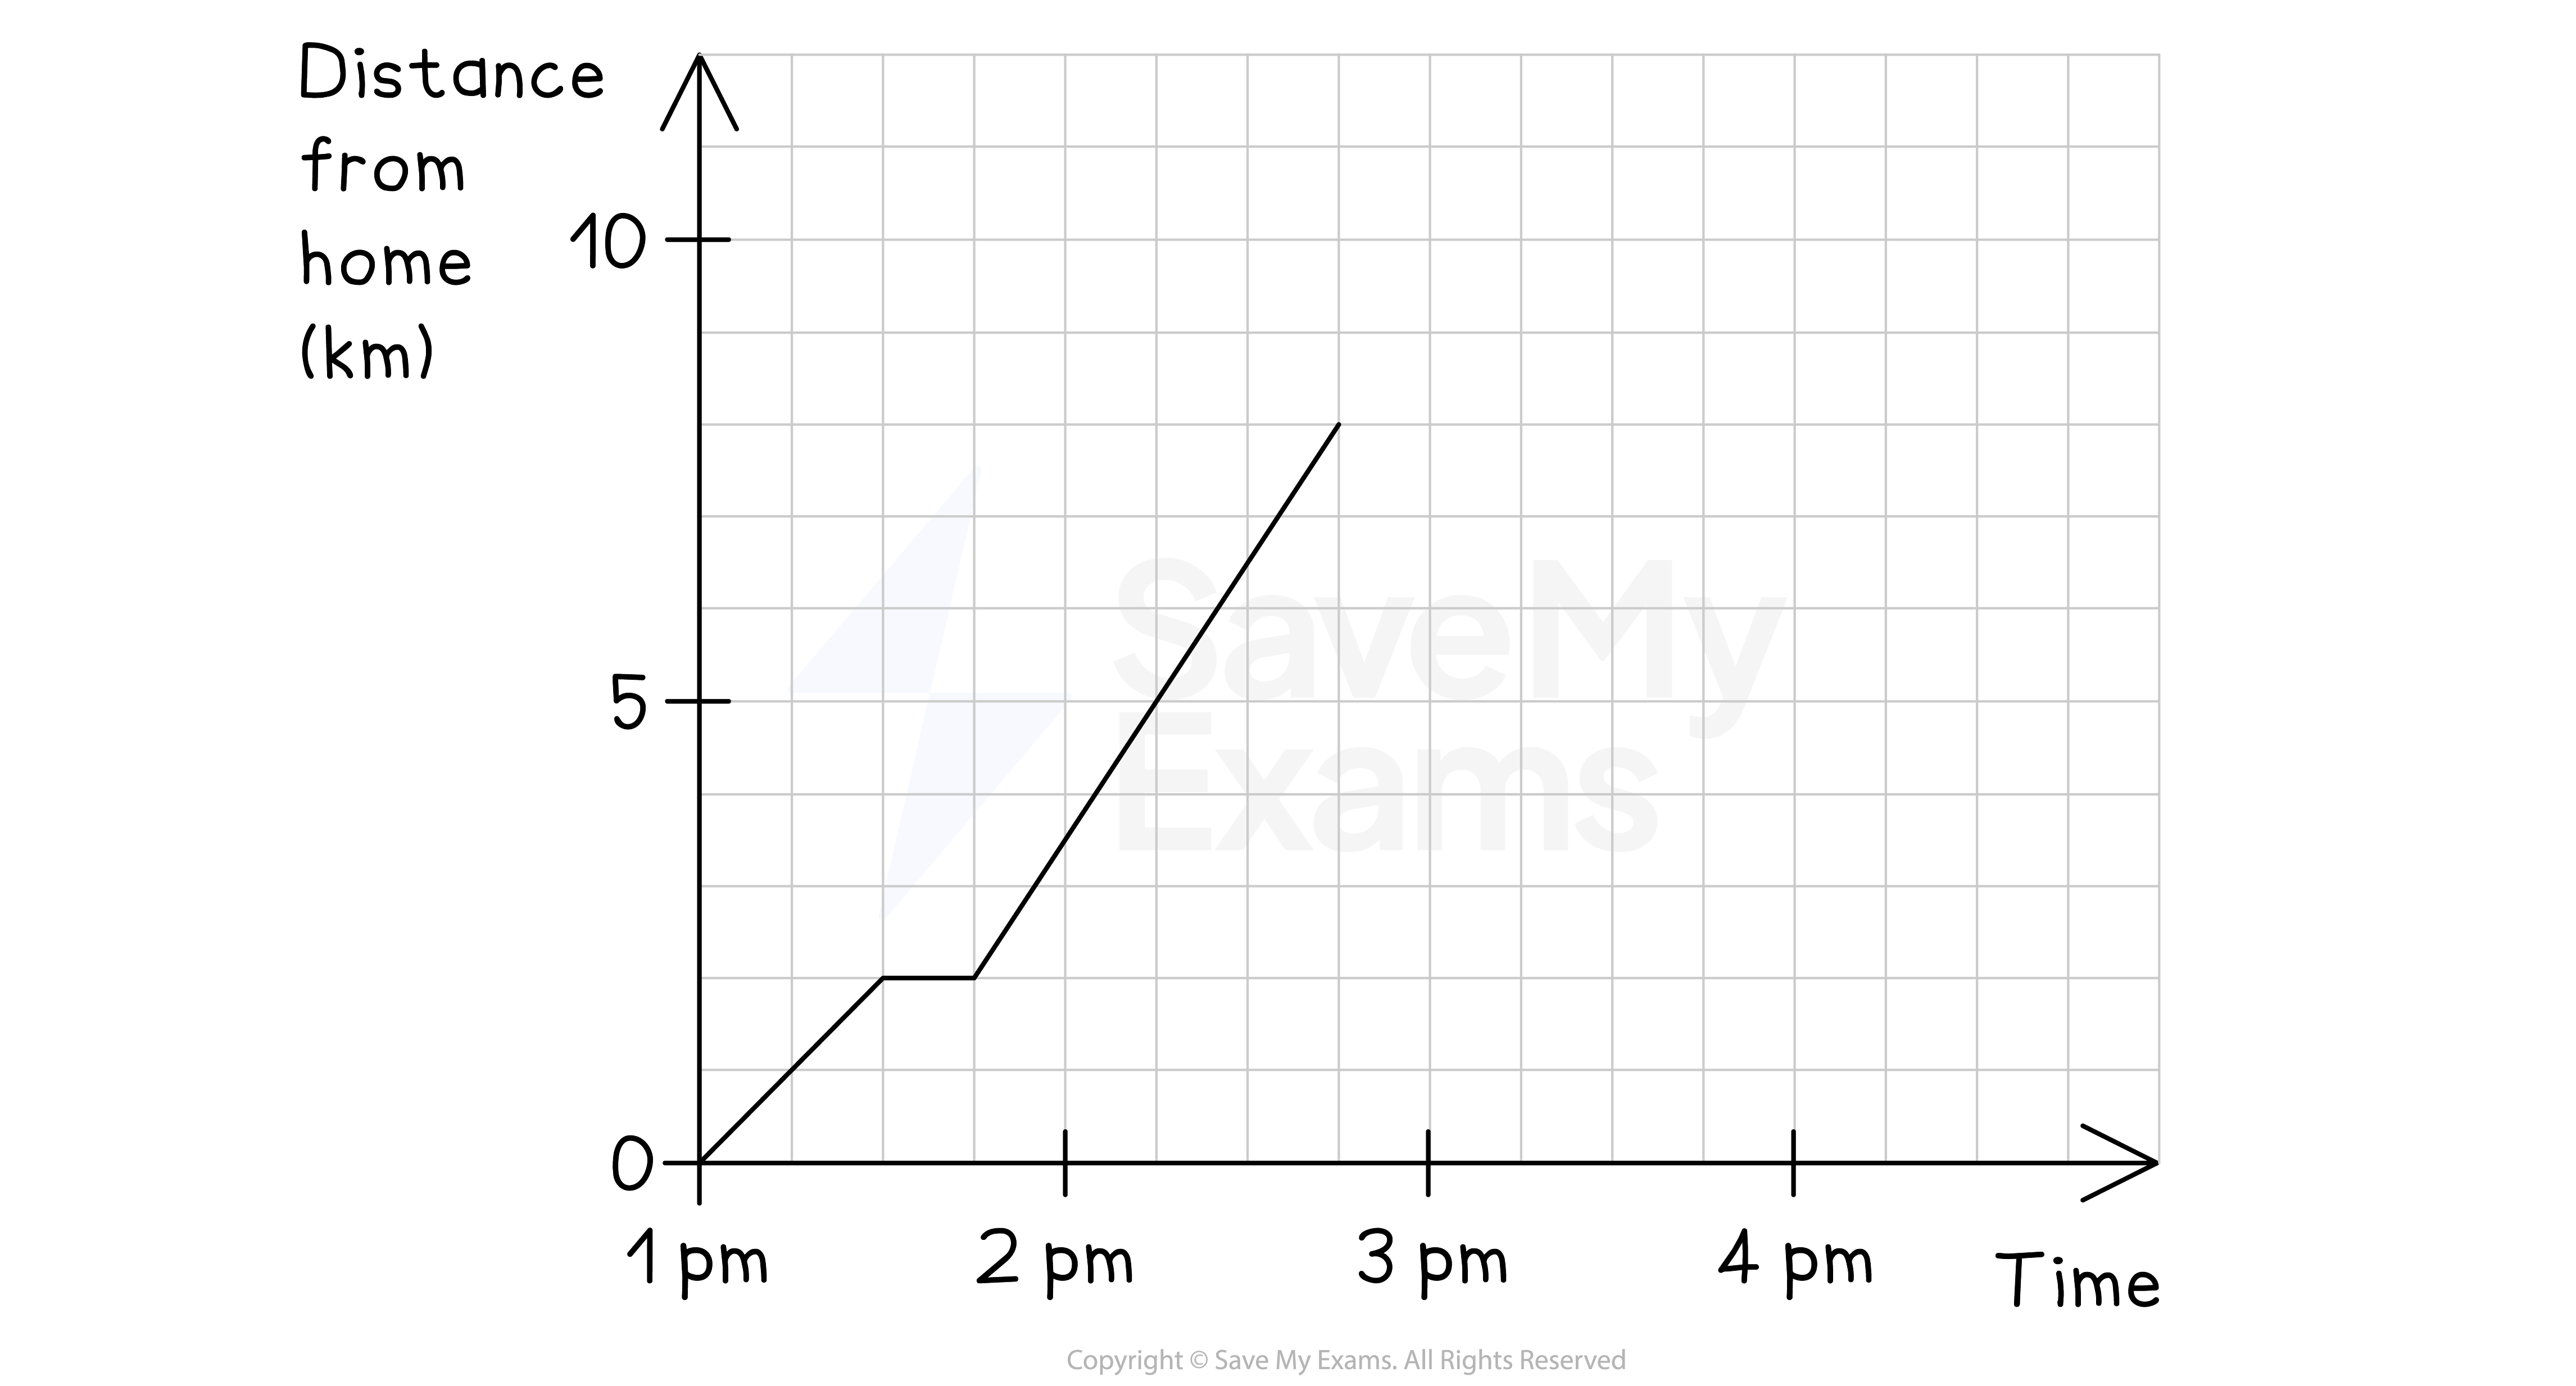
(a) Find Mary's speed at 2 pm.
Answer:
The speed is the gradient of the line at that point
The gradient at 2pm is the same as the gradient for all points between 1:45pm and 2:45pm
It is easiest to use for that bigger section
6 km/h
(b) Calculate, in minutes, how long Mary stopped on the way to her grandfather's house.
Answer:
The horizontal line is where Mary stops
The scale is 1 square = 15 minutes
15 minutes
(c) Calculate Mary's overall average speed from leaving her home to arriving at her grandfather's house, giving your answer correct to 3 significant figures.
Answer:
Overall average speed is
Total distance travelled is 8 km
Total time (including rests) is 1.75 hours
Round the answer to 3 significant figures
4.57 km/h (to 3 s.f.)
(d) Mary stayed at her grandfather's house for half an hour, then jogged home at a steady speed without stopping, arriving home at 4pm.
Complete the travel graph for Mary's journey.
Answer:
Rest is a horizontal line
Returning home is a straight line with a negative gradient
