Conversion Graphs
Conversion Graphs
Conversion graphs
What is a conversion graph?
A conversion graph is a straight-line graph relating two quantities
You can convert (change) between them by reading values off the graph
Common examples include
Temperature
degrees Celsius (°C) and degrees Fahrenheit (°F)
Currency
Dollars ($) and pounds (£)
Volume
Litres and gallons
Prices
A taxi driver charging per kilometre driven
The gradient of a conversion graph represents the rate of change
If the y-axis is the cost of a taxi journey (£) and the x-axis is the distance travelled (mile) then the gradient represents the cost per mile
A gradient of 5 means the cost increases by £5 for each mile travelled
How do I use a conversion graph?
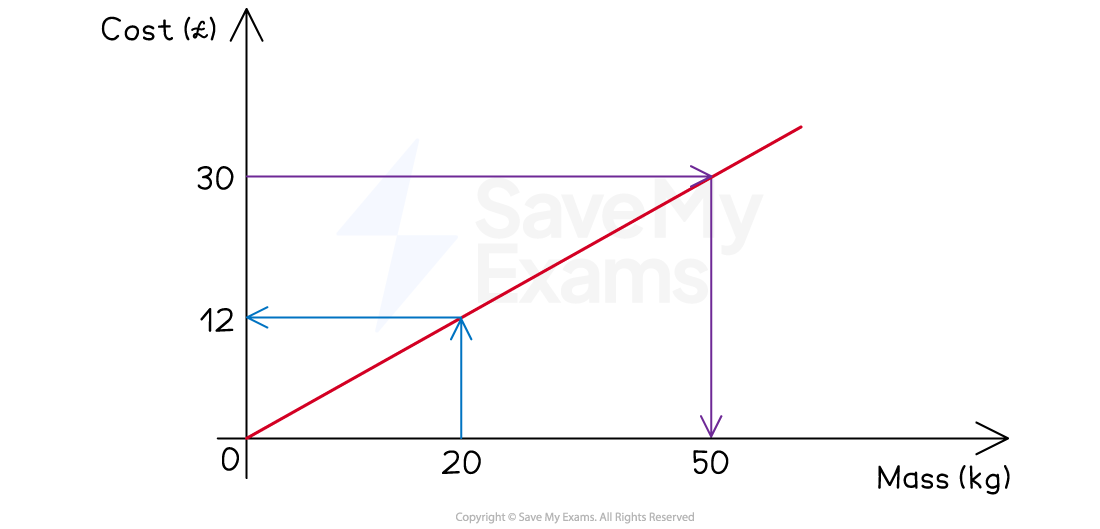
Find the cost of 20kg using the conversion graph below
Start at 20kg on the x-axis
Draw a vertical line to the graph
Then a horizontal line across to the y-axis
Read off the value
£12
Find how many kilograms can be bought with £30
Start at £30 on the y-axis
Draw a horizontal line to the graph
Then a vertical line down to the x-axis
Read off the value
50kg
You can use proportion to find values that on not on the axes
To find the cost of 120kg
120kg = 6 × 20kg costs 6 × £12 = £72
120kg = 50kg + 50kg + 20kg costs £30 + £30 + £12 = £72
You can only do this if the graph starts at the origin
How do I use a conversion graph that does not start at the origin?
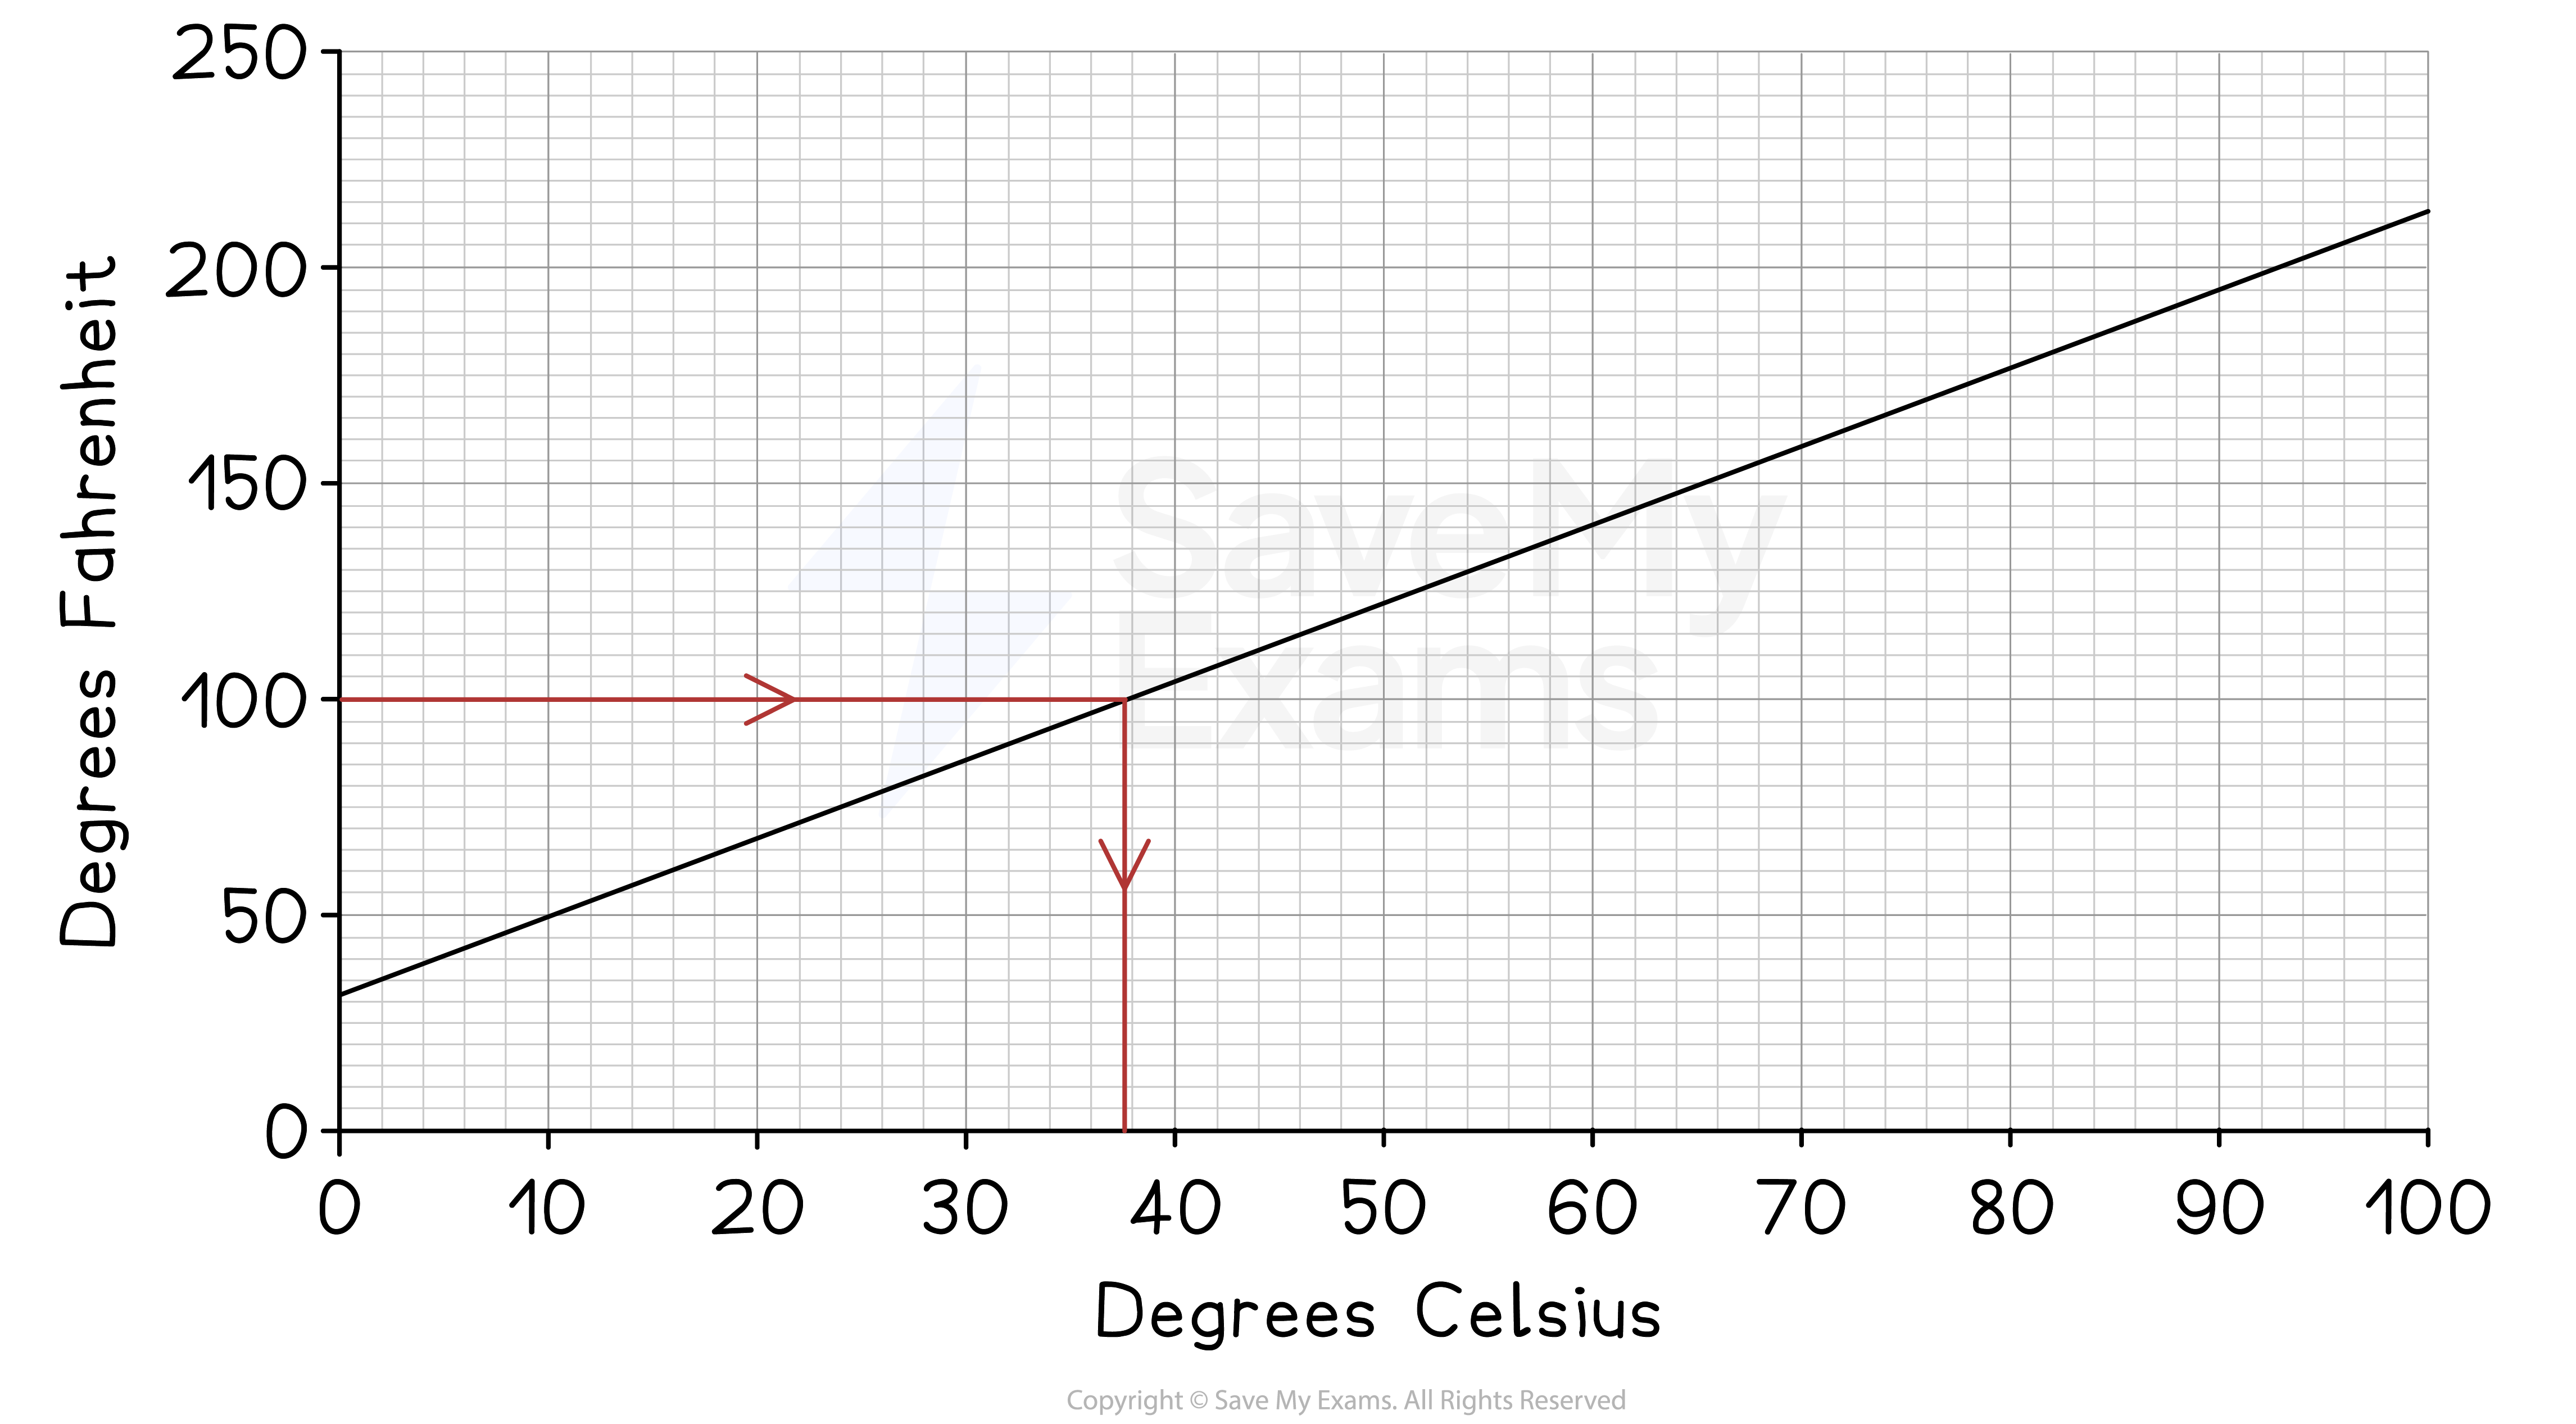
Convert 100°F into Celsius using the conversion graph below
Start at 100°F on the y-axis
Draw a horizontal line to the graph
Then a vertical line down to the x-axis
Read off the value
37.5°C
Answers between 37°C and 38°C would be accepted
(The true answer is 37.8°C to 1 decimal place)
The graph starts at 32 on the y-axis
This means that 0°C is 32°F
This starting value sometimes represents a fixed cost when money is involved
It could represent the fixed charge for the cost of a taxi fare
To convert values that are not on the axis
You would need to find an equation for the straight-line