Rates-of-Change Graphs
Rates of Change of Graphs
Rates of change of graphs
What is a rate-of-change graph?
A rate-of-change graph usually shows how a variable changes with time
The following are examples of rates-of-change graphs:
Speed against time
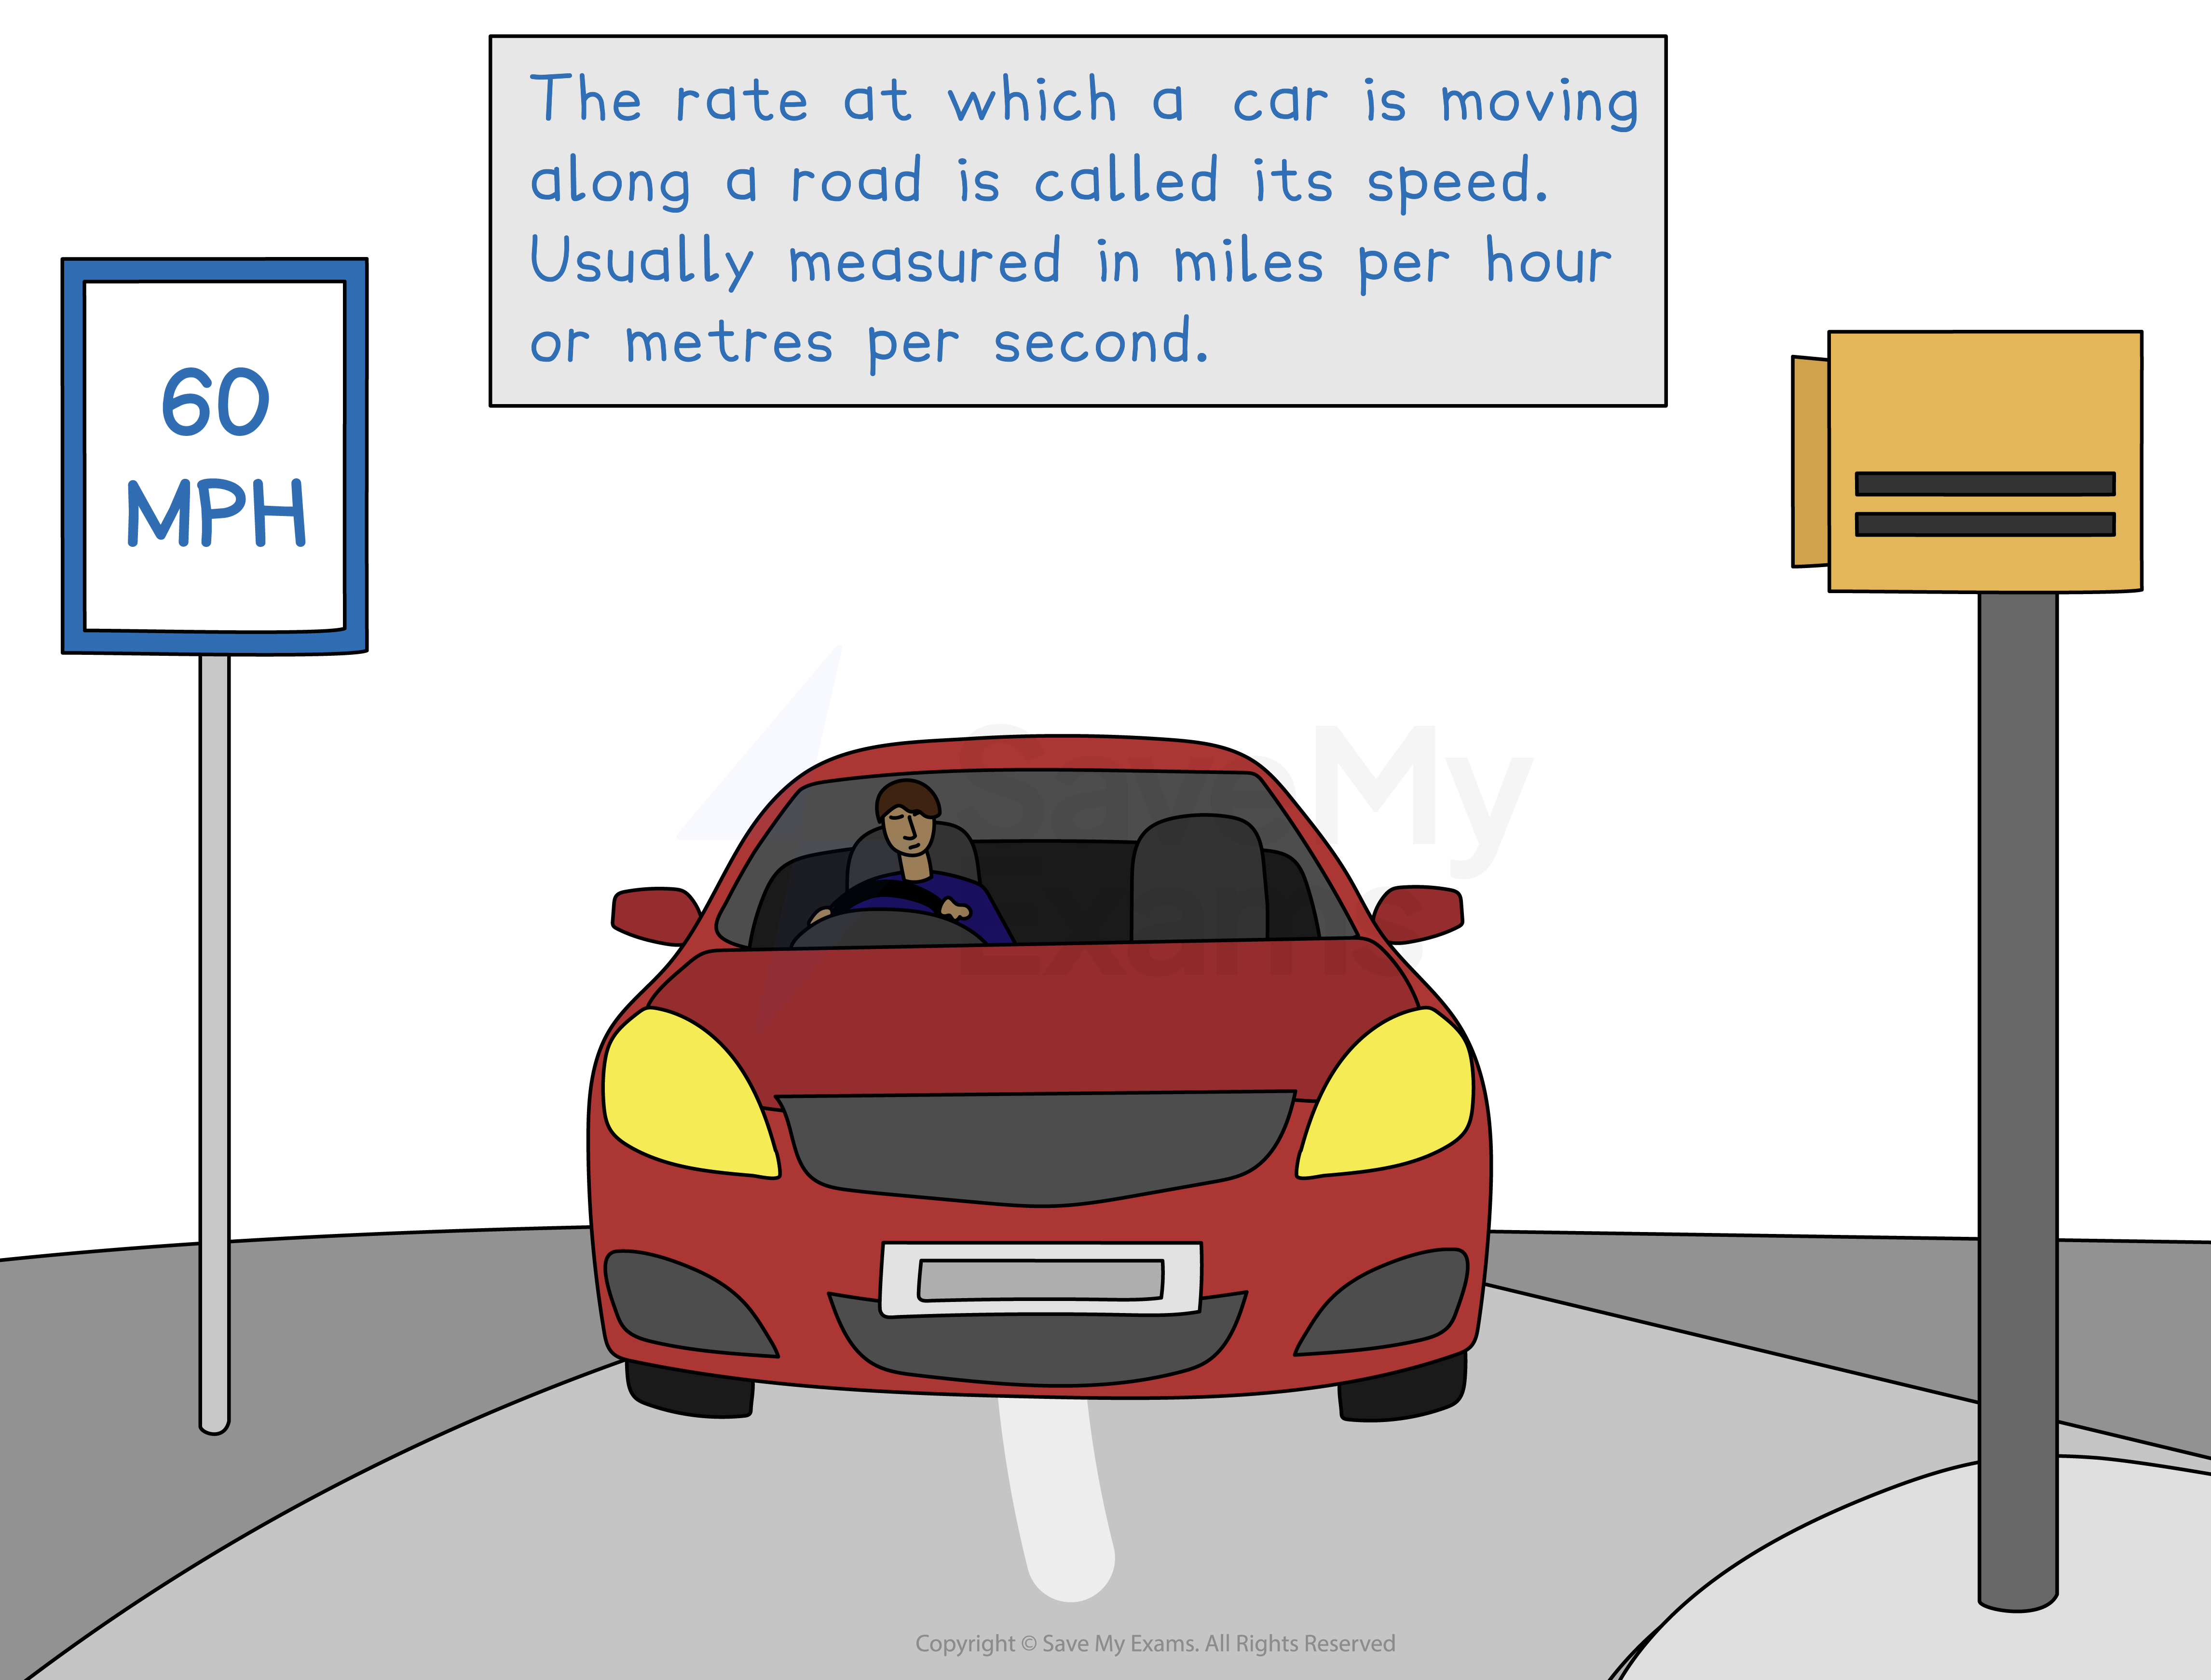
Speed is the rate of change of distance as time increases
Acceleration against time
Acceleration is the rate of change of velocity as time increases
The depth of water against time (e.g. in a container as it is filled with water)
Do rates-of-change graphs always include time as a variable?
More generally, rate-of-change graphs can show any two different variables plotted against each other, not just time
E.g. the volume of air inside an inflating balloon plotted against the balloon's radius
This shows the rate of change of volume as radius increases
E.g. the speed of an object plotted against its distance from the starting point
This shows the rate of change of the speed of an object as it moves further away from the starting point
How can I use gradients to find rates of change?
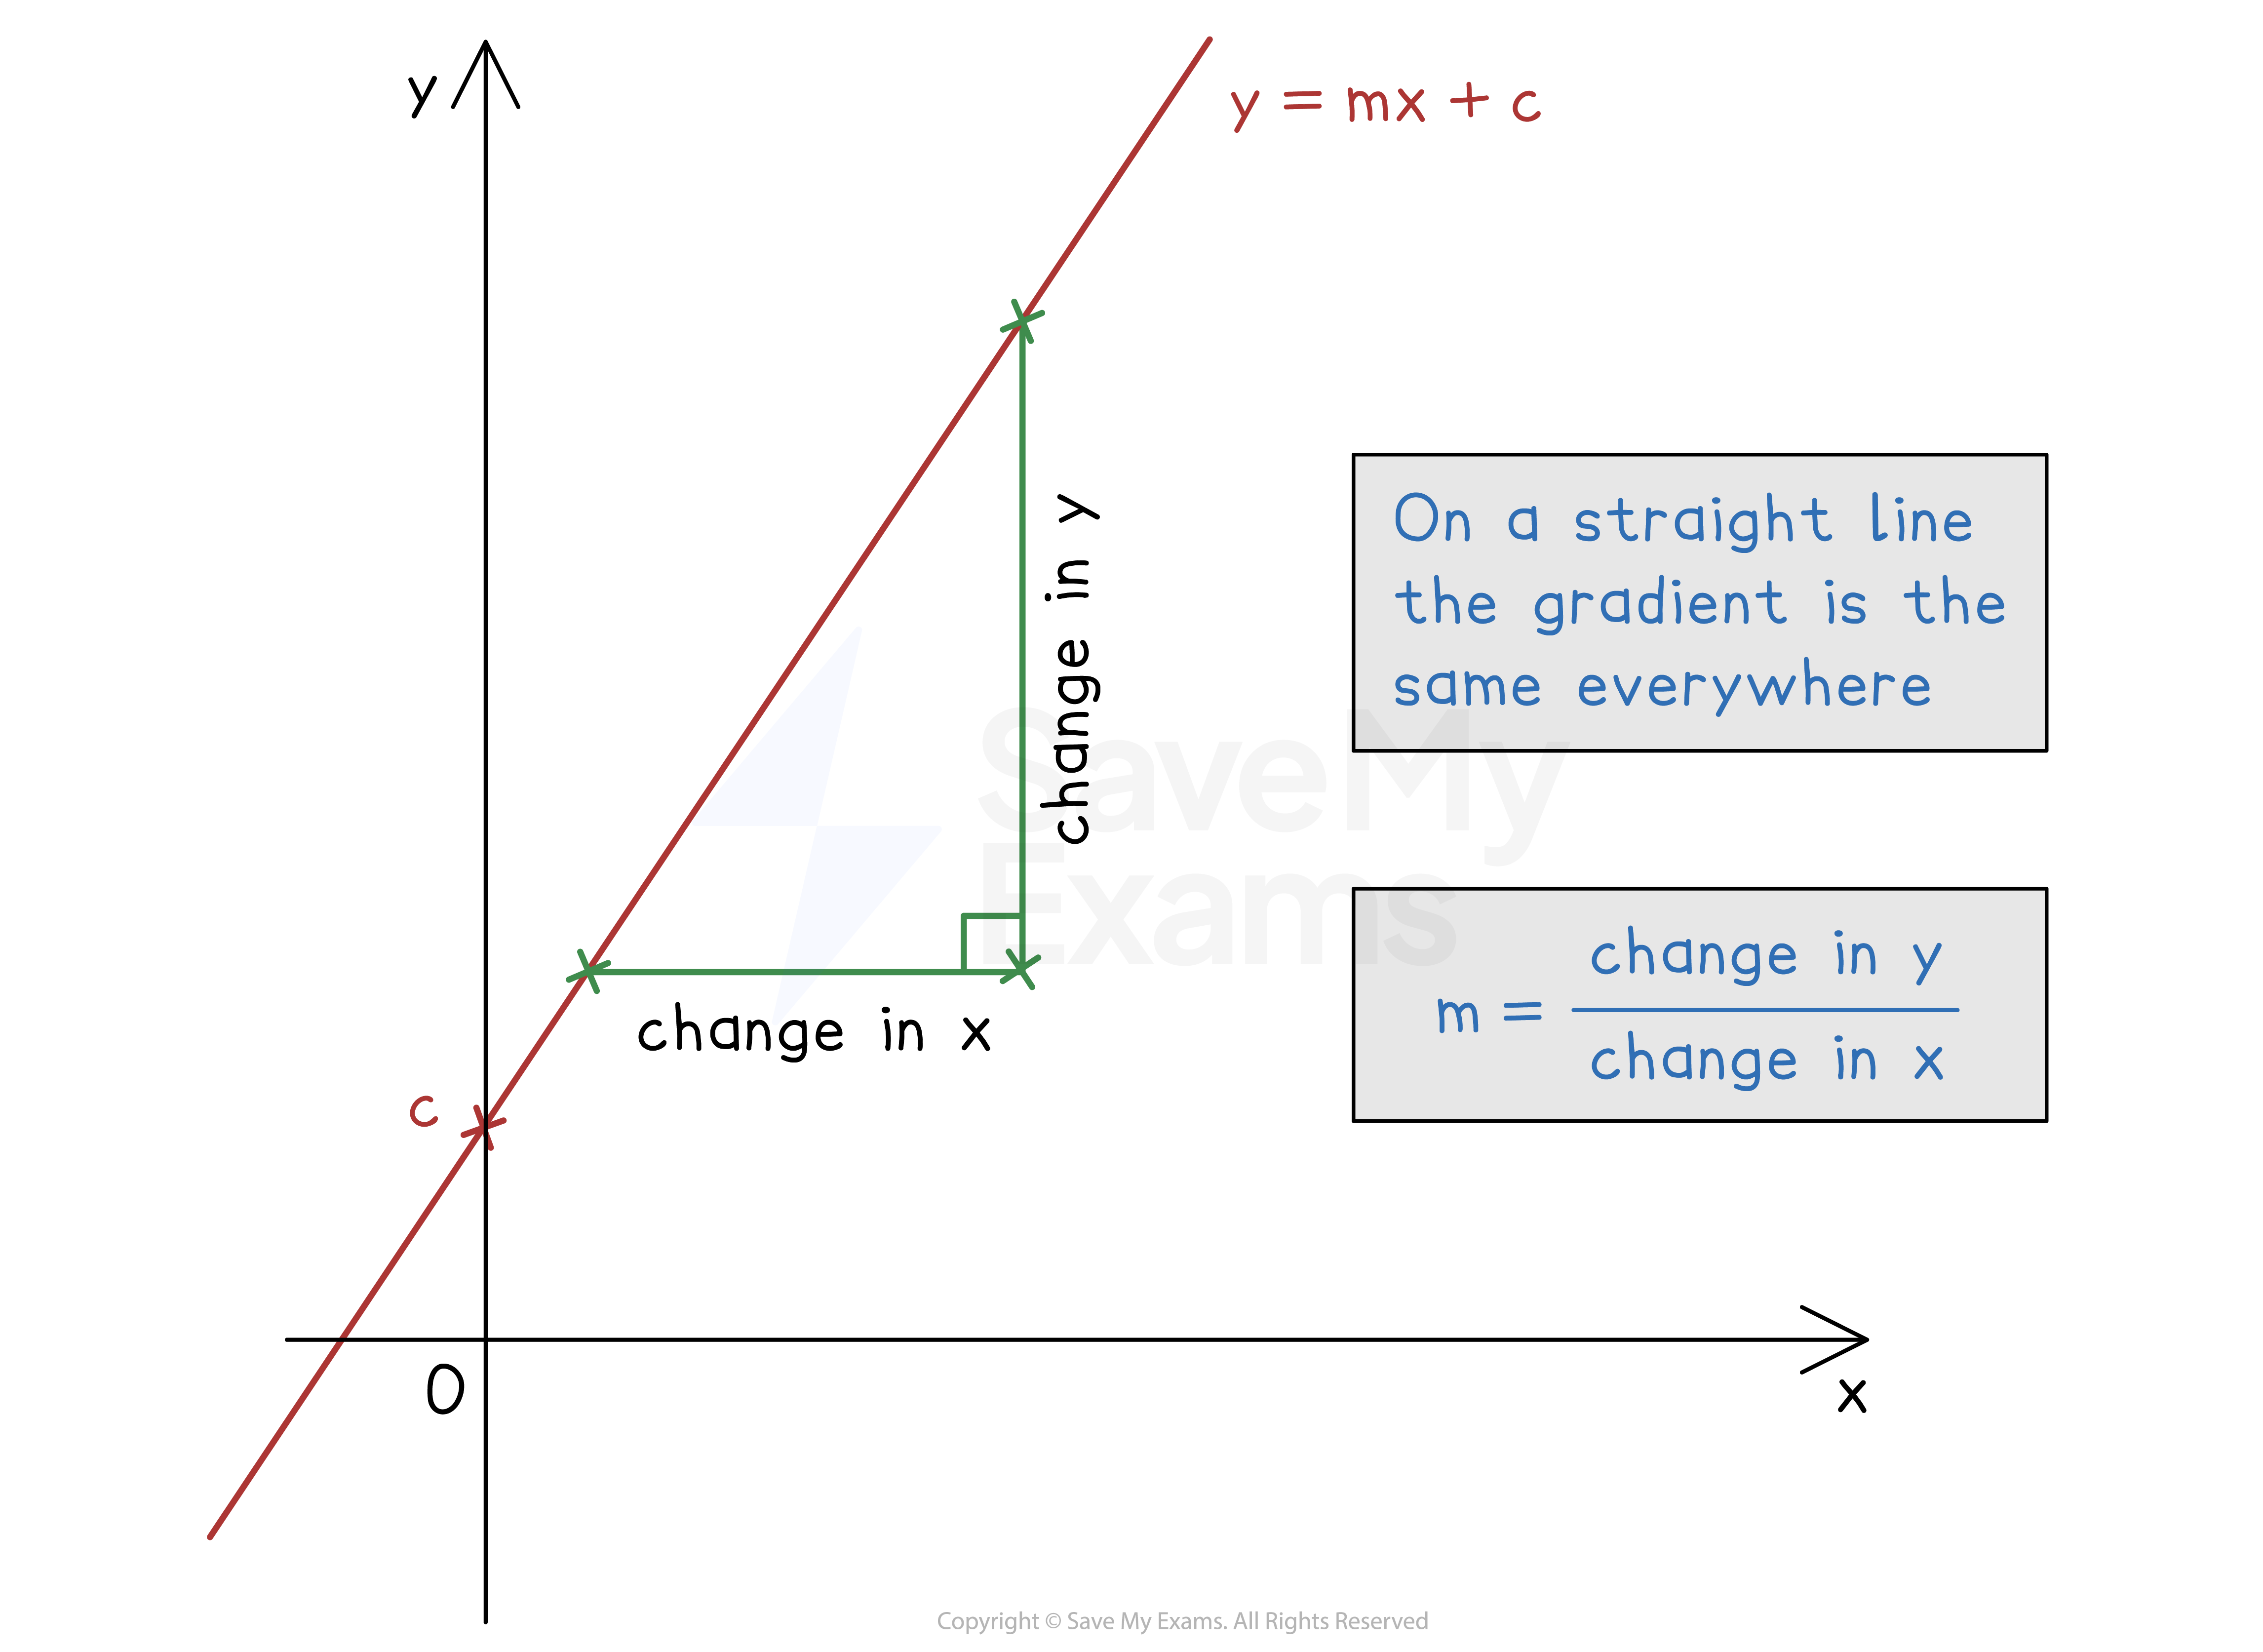
The gradient of the graph of y against x represents:
the amount of change in y for every 1 unit of increase in the x-direction
This is the amount of y per unit of x
This is called the rate of change of y against x
The units of gradients are the units of the y-axis, divided by the units of the x-axis
E.g. If the graph shows volume in cm3 on the y-axis and time in seconds on the x-axis, the rate of change is measured in cm3/s (or cm3s-1)
If the graph is a straight line the rate of change is constant
If the graph is horizontal, the rate of change is zero
y is not changing as x changes
How can I use tangents to find rates of change?
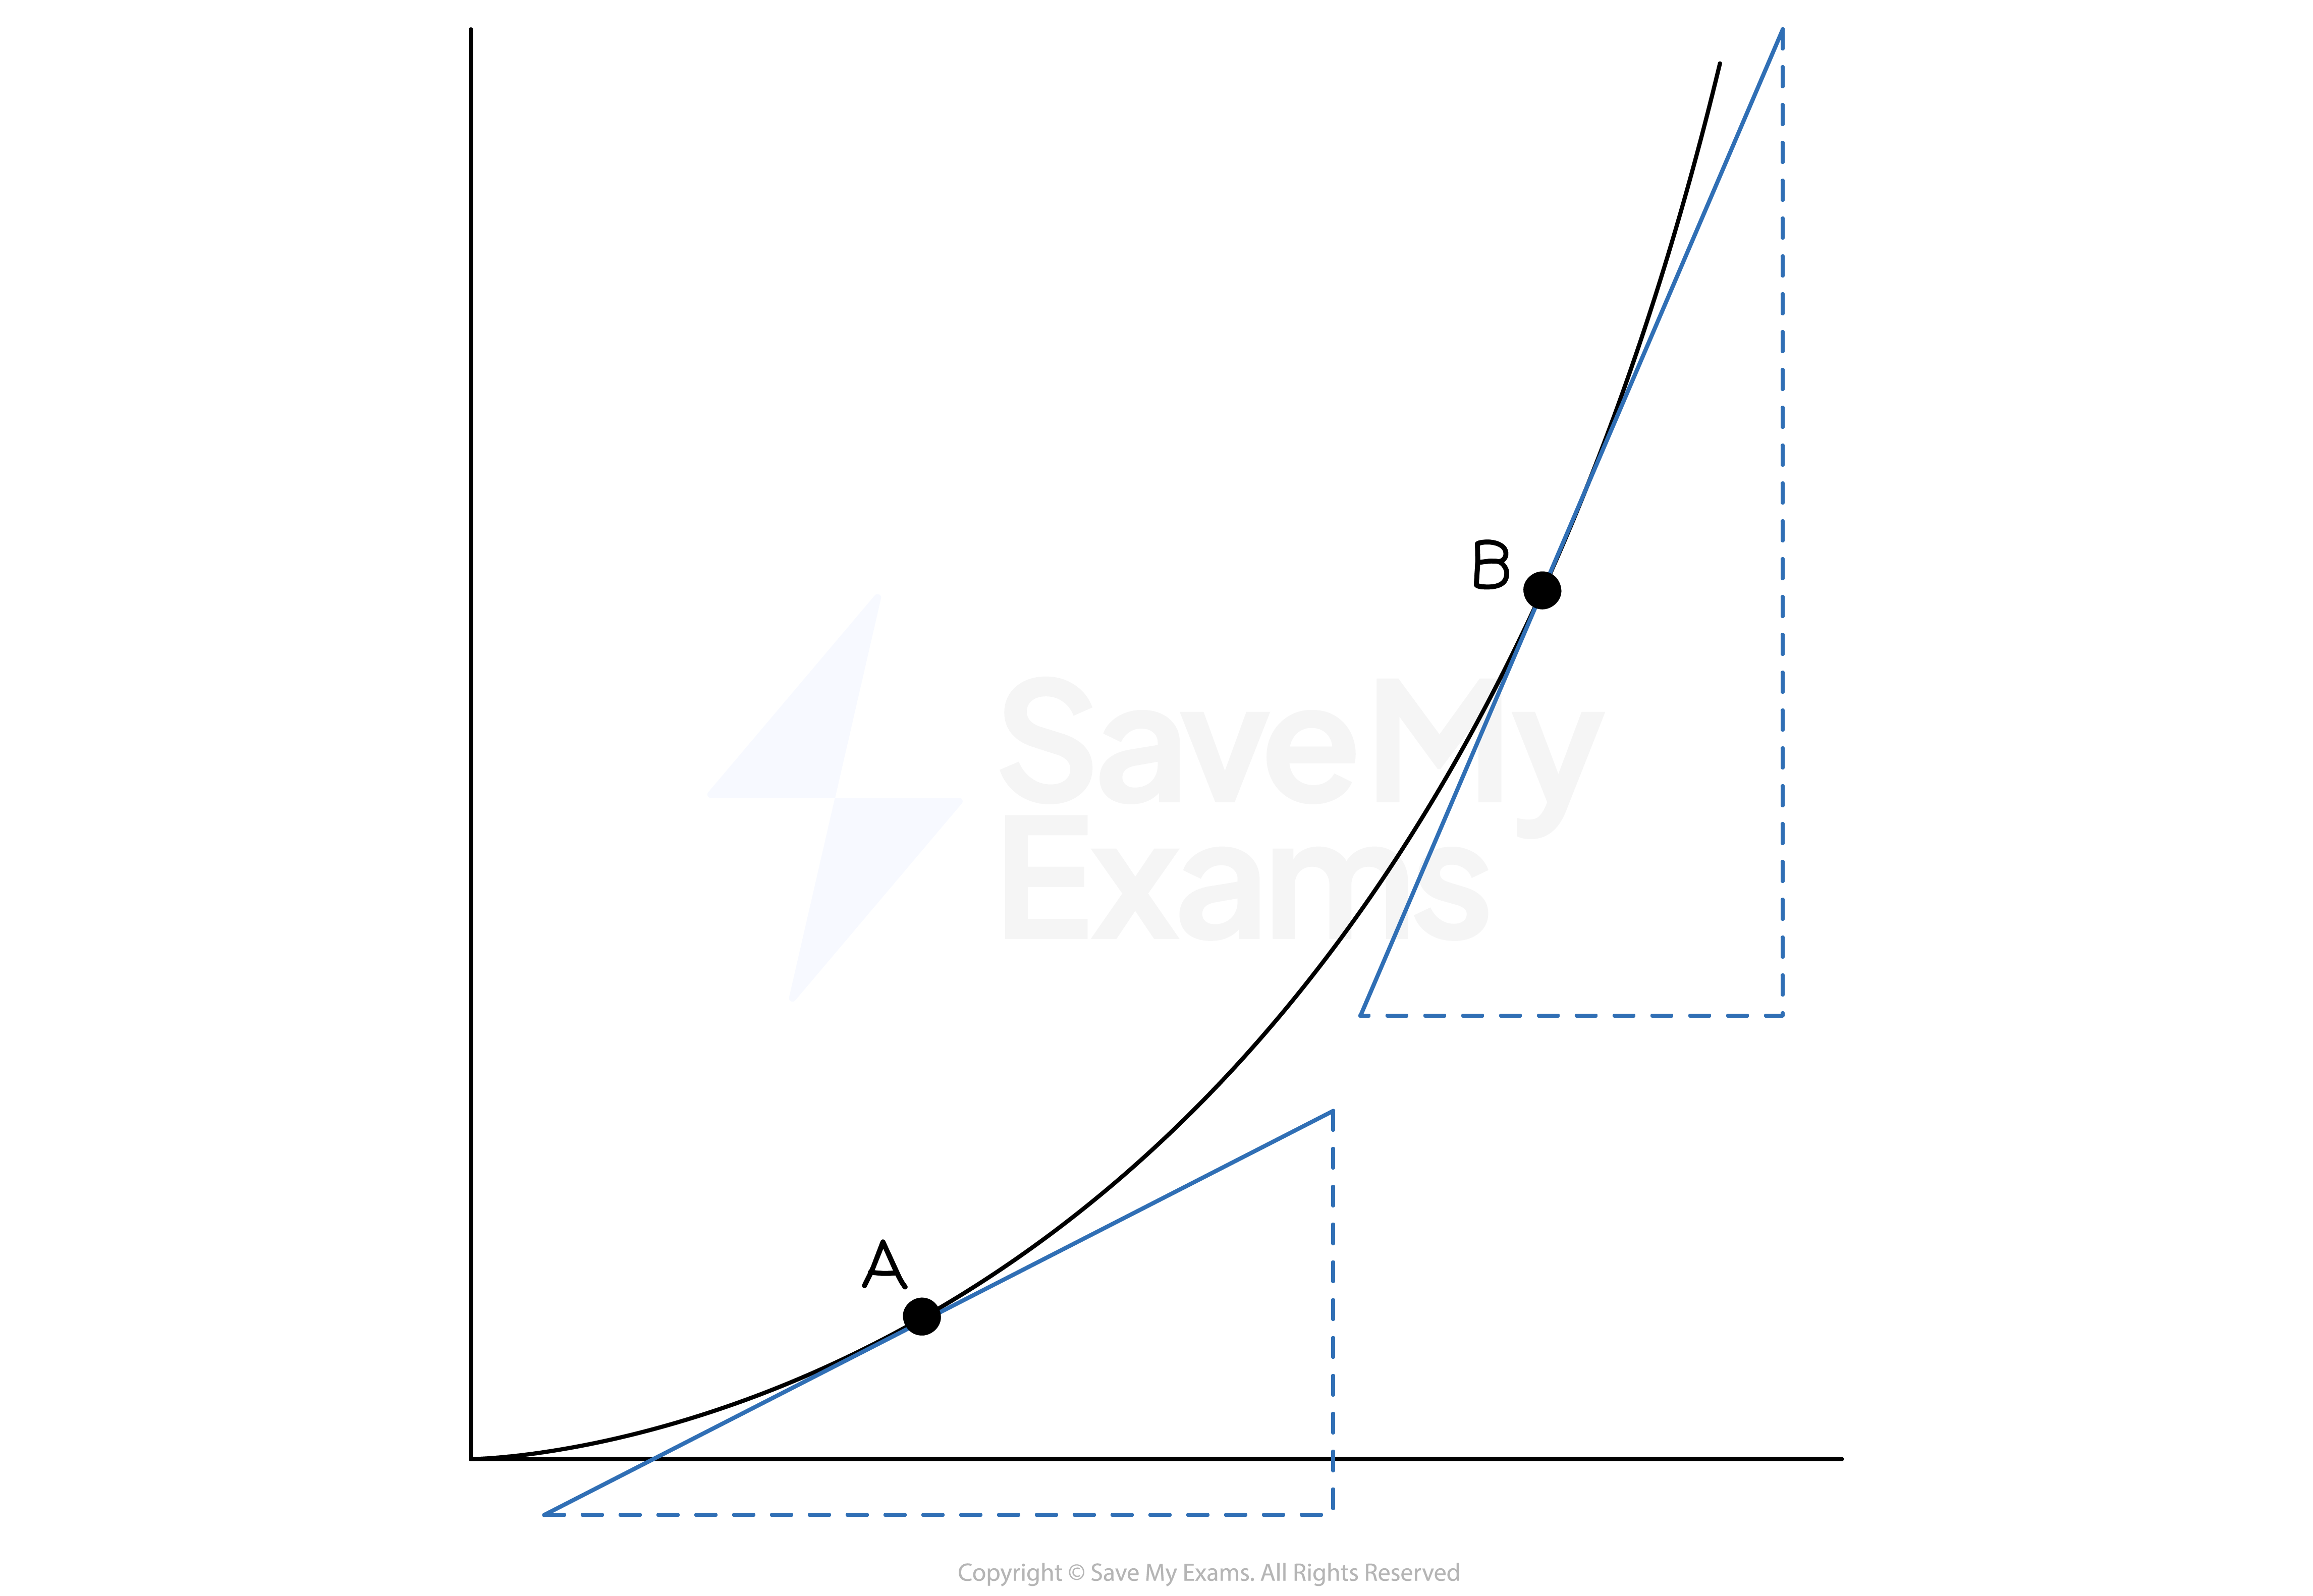
If the graph is a curve, you can draw a tangent at a point on the graph and find its gradient
This will be an estimate of the rate of change of y against x
The rate of change is greater when the graph is steeper
In the below image
tangents drawn at points A and B show the graph is steeper at B
therefore the rate of change at B is greater
On a distance-time graph, a tangent at a point on the curve can be used to estimate the velocity at that particular time
On a speed-time graph, a tangent at a point on the curve can be used to estimate the acceleration at that particular time