Graphs of Cubic Polynomials
Graphs of Cubic Polynomials
Graphs of cubic polynomials
What is a cubic polynomial?
A cubic polynomial is a function of the form
and are constants
it is a polynomial of degree 3
so and/or could be zero
To sketch the graph of a cubic polynomial it will need to be in factorised form
e.g. is the factorised form of
What does the graph of a cubic polynomial look like?
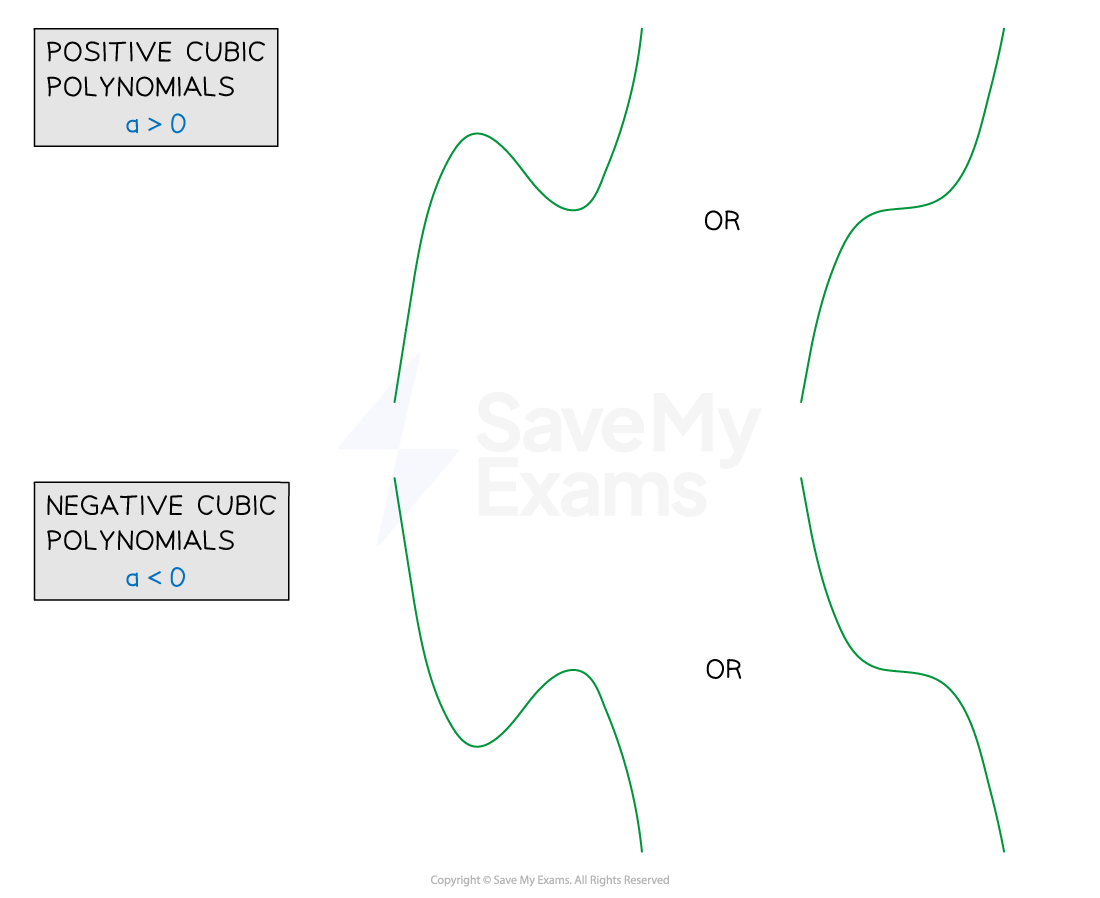
In general the graph of a cubic polynomial will take one of the four forms
All are smooth curves that take some practice to sketch!
The exact form a particular cubic polynomial will depend on
The number (and value) of roots (-axis intercepts) of the cubic polynomial
The -axis intercept
The sign of the coefficient of the term ()
If the graph is a positive cubic ('starts' in the third quadrant, 'ends' in the first)
If the graph is a negative cubic ('starts' in the second quadrant, 'ends' in the fourth)
Turning points
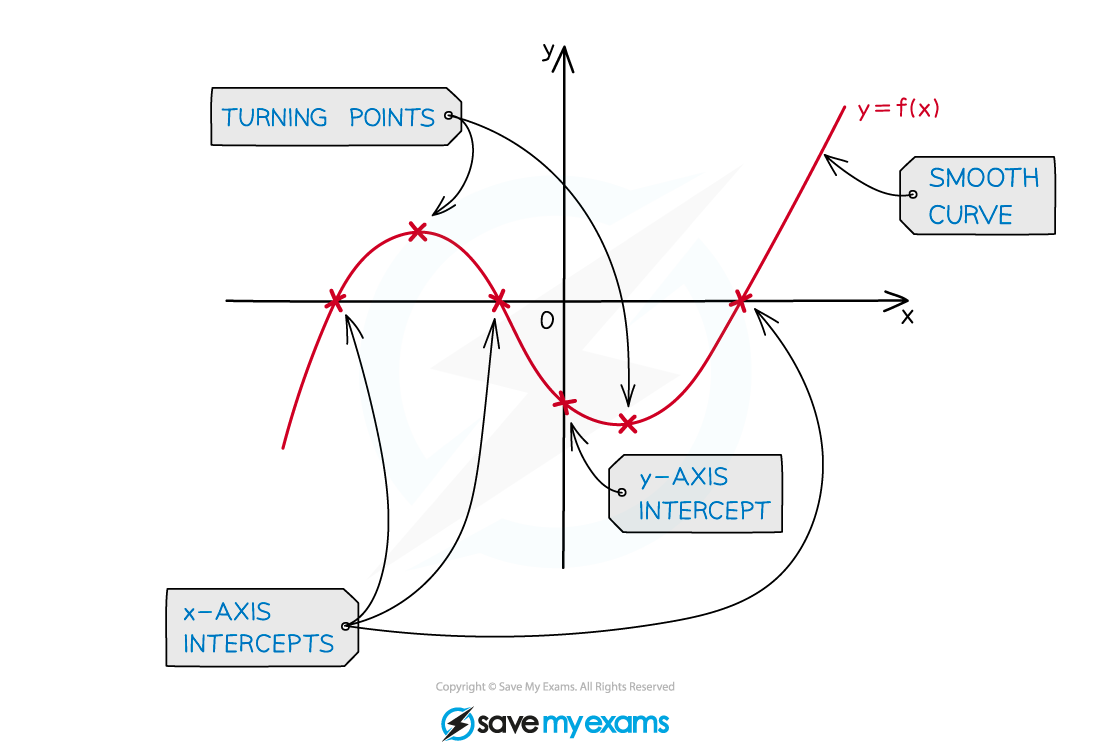
How do I sketch the graph of a cubic polynomial?
STEP 1 Find the -axis intercept by setting
STEP 2 Find the -axis intercepts (roots) by setting (Any repeated roots will mean the graph touches - rather than crosses - the -axis)
STEP 3 Consider the shape of the graph - is it a positive cubic or a negative cubic? Where does the graph 'start' and 'end'?
STEP 4 Consider where any turning points should go
STEP 5 Sketch the graph with a smooth curve, labelling points where the graph intercepts the and axes
Modulus Cubic Graphs
Modulus cubic graphs
What is a modulus cubic graph?
A (factorised) cubic polynomial is of the from
The graph of must cross the -axis at least once
therefore must take both positive and negative values
The modulus cubic graph, will mean all values of are positive
Any negative values become their positive equivalents
e.g. If then , but
A modulus cubic graph will not have any negative values
the graph will not cross the -axis
the graph will touch the -axis (at least once)
How do I sketch a modulus cubic graph?
Sketch the graph of the (original) cubic polynomial,
Any parts of this graph that are below the -axis should be reflected in the -axis to sketch the graph of
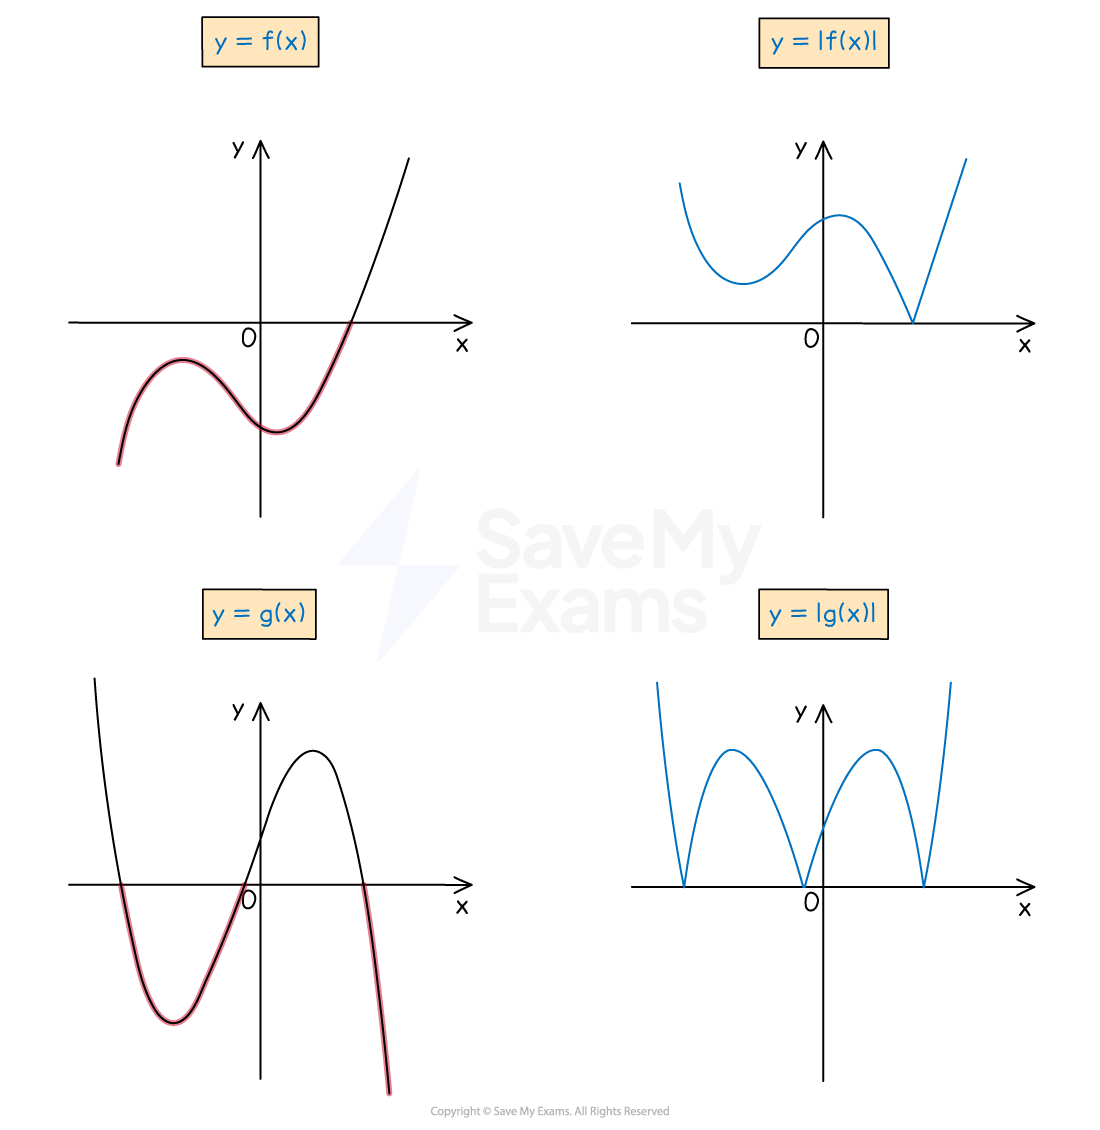
The points at which a modulus graph touches the -axis are the same as the points at which the original graph intercepts the -axis (i.e. the roots of )
Label these points, and the -axis intercept, on a sketch
Notice that the points at which a modulus graph touches the -axis are not smooth
they are 'pointy' (V-shaped)
turning points are smooth (U-shaped)
How do I find a cubic function from its modulus graph?
To deduce a cubic expression from its modulus graph consider
whether the (original) expression could be a positive or negative cubic
a positive cubic 'starts' in the third quadrant and 'ends' in the first
a negative cubic 'starts' in the second quadrant and 'ends' in the fourth
a negative cubic can have a "-" at the start of its expression
the -axis intercepts - the roots
for the roots and , write the factors
the -axis intercept - to deduce the expression in the form
lots of cubic functions have the same roots but have different coefficients
the -axis intercept should be the product
may often, but not always, be 1
Solving Cubic Inequalities Graphically
Solving cubic inequalities graphically
What is a cubic inequality?
A cubic function is of the form where and are constants
A cubic inequality can be any of the following
An inequality may need rearranging into one of these forms first before solving
Furthermore, solving cubic equations graphically is easiest when the expression has been factorised
e.g. for a cubic with three (real) roots this would be where and are the roots
How do I solve a cubic inequality graphically?
STEP 1 If need be, rearrange the inequality so that one side of the inequality is zero This should leave a cubic polynomial on the other side Factorise the cubic polynomial if required e.g.
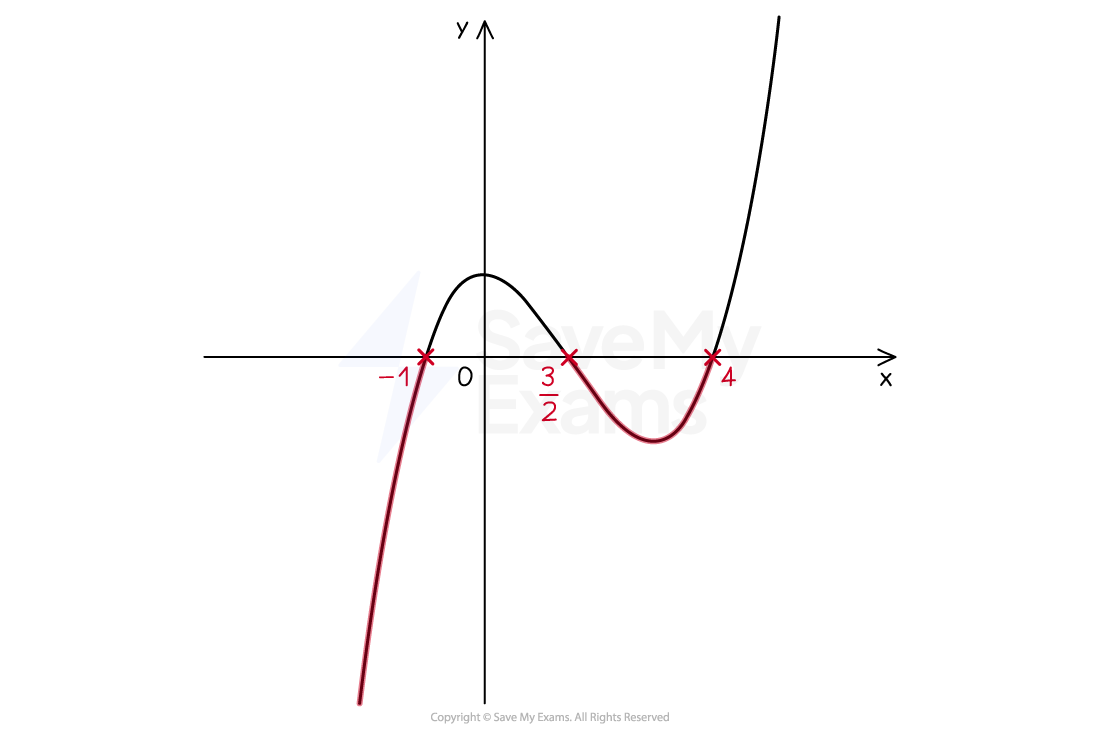
STEP 2 Sketch the graph of the cubic polynomial The -axis intercepts (roots) are crucial to finding the solution but the -axis intercept is not needed e.g.

STEP 3
Identify the part(s) of the graph that satisfy the inequality
Highlighting this on the sketch will help
Consider whether you need to include (≤, ≥) or exclude (<, >) the roots e.g.
STEP 4
Write down the solutions to the inequality
e.g.