Quadratic Graphs
Quadratic Graphs
Quadratic graphs
A quadratic is a function of the form where is not zero They are a very common type of function in mathematics, so it is important to know their key features
What does a quadratic graph look like?
The shape made by a quadratic graph is known as a parabola
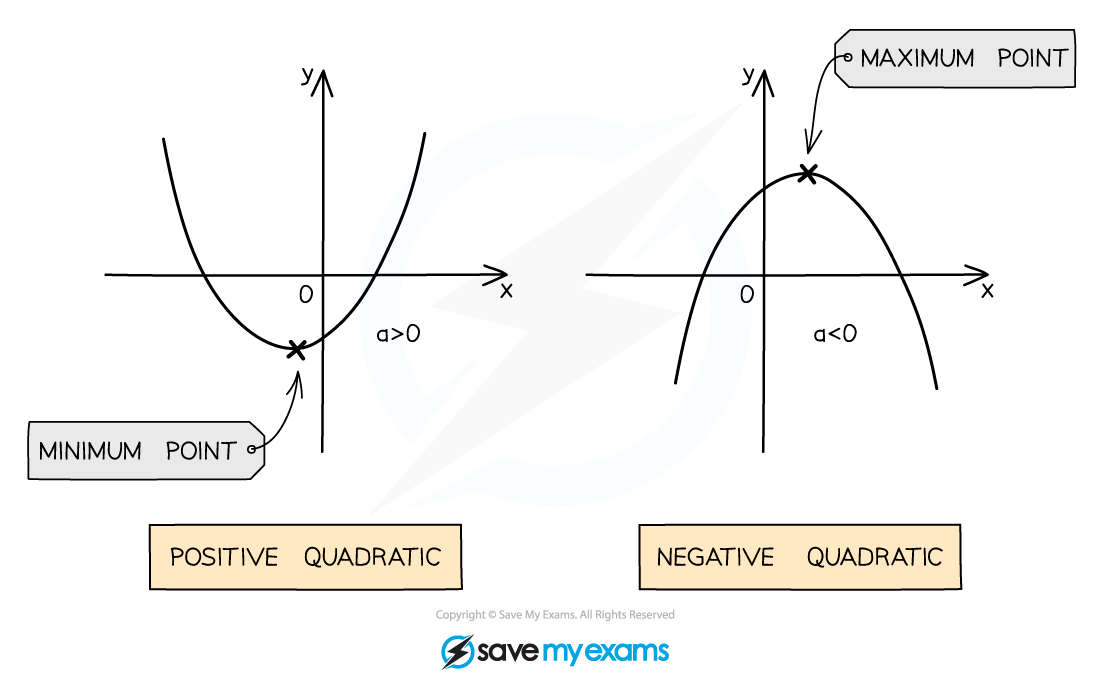
The parabola shape of a quadratic graph can either look like a “∪-shape” or a “∩-shape”
A quadratic with a positive coefficient of will be a ∪-shape
A quadratic with a negative coefficient of will be a ∩-shape
A quadratic will always cross the -axis
A quadratic may cross the -axis twice, once, or not at all
The points where the graph crosses the -axis are called the roots
If the quadratic is a ∪-shape, it has a minimum point (the bottom of the ∪)
If the quadratic is a ∩-shape, it has a maximum point (the top of the ∩)
Minimum and maximum points are both examples of turning points
How do I sketch a quadratic graph?
We could create a table of values for the function and then plot it accurately
However we often only require a sketch to be drawn, showing just the key features
The key features needed to be able to sketch a quadratic graph are
the overall shape
∪-shape graphs occur when (positive quadratic)
∩-shape graphs occur when (negative quadratic)
the -intercept(s), these are also known as the roots (there may be none!)
roots are found by setting the quadratic function (or ) equal to zero
i.e. solve
if there are no (real) solutions (i.e. no roots), the graph does not intersect the -axis
the discriminant can be used to determine whether a quadratic function has 0, 1 or 2 roots
the -intercept
this is found by setting in the quadratic function
so for the coordinates of the -intercept will be
the minimum or maximum point (turning point)
sometimes a rough idea of where this should lie is enough
sometimes the specific coordinates of the turning point will be needed
when required the coordinates of the turning point can be found by either completing the square or differentiation
in cases where the quadratic has just one root, the graph will touch (rather than cross) the -axis and so this will be the turning point
Sketching Graphs by Completing the Square
Sketching graphs by completing the square
How does completing the square help me sketch graphs?
Completing the square can quickly tell us the coordinates of the turning point on a quadratic graph
This is based on the fact that a squared term (e.g. ) cannot be negative
STEP 1
Complete the square - rewrite in the formSTEP 2
Deduce the -coordinate of the turning pointfor all values of
Therefore it's minimum value is 0, and this occurs when
The -coordinate is
STEP 3
Deduce the -coordinate of the turning pointTherefore
The -coordinate is
STEP 4
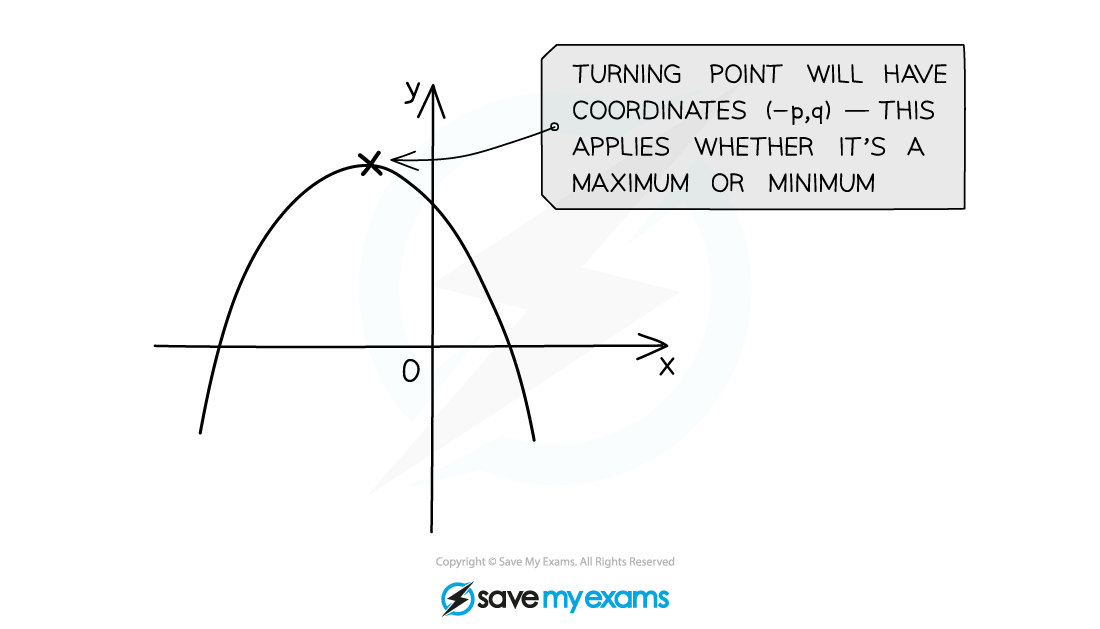
The turning point has coordinates This can be considered when sketching the graph of the quadratic functionNote that the turning point could be a maximum or minimum point - this will depend on the value of
is the coefficient of the term
If is positive, the graph is - shaped and will have a minimum point
If is negative, the graph is - shaped and will have a maximum point
How do I use the graph of a quadratic function to find its range?
The range of a quadratic function will be shown on its graph by the values takes
i.e. the turning point from a quadratic graph will determine its range
For the quadratic function whose graph has a minimum point
the range of the will be
For the quadratic function whose graph has a maximum point
the range of will be
If there any restrictions on the domain of then they could affect the range of