Quadratic Inequalities
Quadratic Inequalitiesvideo
Quadratic inequalities
What are quadratic inequalities?
They are similar to quadratic equations with the "=" replaced by one of <, >, ≤ or ≥
Just like equations such inequalities should be in a form such that 0 is on one side of the inequality
e.g.
Sketching a quadratic graph is essential to finding the correct solution(s)
Some modern calculators may be able to solve quadratic inequalities directly
You could use this to check your answer

How do I solve quadratic inequalities?
STEP 1
Rearrange the inequality into quadratic form with a positive squared term ax2 + bx + c > 0 (>, <, ≤ or ≥)STEP 2
Find the roots of the quadratic equation Solve ax2 + bx + c = 0 to get x1 and x2 where x1 ≤ x2STEP 3
Sketch the graph of the quadratic and label the roots As Step 1 makes the -squared term positive it will be -shapedSTEP 4
Identify the region that satisfies the inequality For ax2 + bx + c > 0 you want the region above the x-axis - the solution will be x < x1 or x > x2 For ax2 + bx + c < 0 you want the region below the x-axis - the solution will be x1 < x < x2
Be careful:
avoid multiplying or dividing by a negative number
if unavoidable, “flip” the inequality sign so < → >, ≥ → ≤, etc
do rearrange to make the x2 term positive
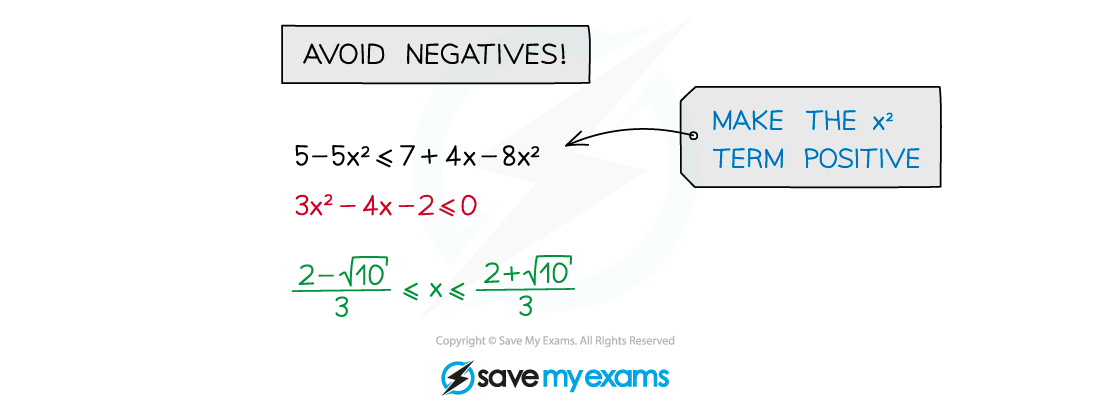
Quadratic inequalities and the discriminant
The discriminant of the quadratic function is
It's value indicates the number of (real) roots the quadratic function has
if there are two roots
if there is one root (repeated)
if there are no roots
The firsts and last of these are quadratic inequalities
Some questions will require you to use the discriminant to set up and solve a quadratic inequality
For example: Find the values of such that the equation has no real roots
Using the discriminant, and for no real roots,
Using the approach above, this leads to the quadratic inequality in ,
And using the method above, including sketching a graph, leads to the solutions and
Inequalities on Graphsvideo
Inequalities on graphs
What are inequalities on graphs?
Inequalities can be represented on graphs by shaded regions and dotted or solid lines
These inequalities have two variables, x and y
Several inequalities are used at once
The solution is an area on a graph (often called a region and labelled R)
The inequalities can be linear or quadratic

How do I draw inequalities on a graph?
Sketch each line or curve
If the inequality is strict (< or >) then use a dotted line
If the inequality is weak (≤ or ≥) then use a solid line
Decide which side of the line satisfies the inequality
If unsure, choose a coordinate on one side and test it in the inequality
The origin is an easy point to use
If it satisfies the inequality then that whole side of the line satisfies the inequality
For example: (0,0) satisfies the inequality y < x2 + 1 so you want the side of the curve that contains the origin