Movements Along & Shifts of the Demand Curve
Movements along a demand curve
Movements along a demand curve
If price is the only factor that changes (ceteris paribus), there will be a change in the quantity demanded (QD)
This change is shown by a movement along the demand curve
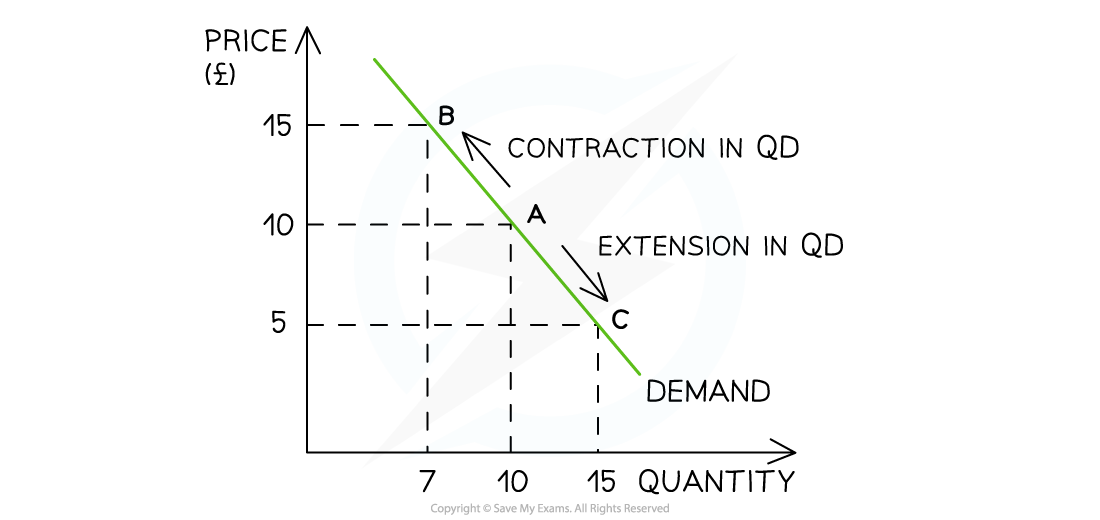
Diagram analysis
An increase in price from £10 to £15 leads to a movement up the demand curve from point A to B
Due to the increase in price, the QD has fallen from 10 to 7 units
This movement is called a contraction in QD
A decrease in price from £10 to £5 leads to a movement down the demand curve from point A to point C
Due to the decrease in price, the QD has increased from 10 to 15 units
This movement is called an extension in QD
The law of demand captures this fundamental relationship between price and QD
It states that there is an inverse relationship between price and QD
When the price rises the QD falls
When prices fall the QD rises
Shifts of the demand curve
Shifts of the demand curve
There are numerous factors that will change the demand for a good/service, irrespective of the price level
Collectively, these factors are called the conditions of demand and include
Changes in real income
Changes in consumer tastes and preferences
Changes in the price of related goods (substitutes and complements)
Changes in the number of consumers
Future price expectations
Changes to each of the conditions of demand, shift the entire demand curve (as opposed to a movement along the demand curve)
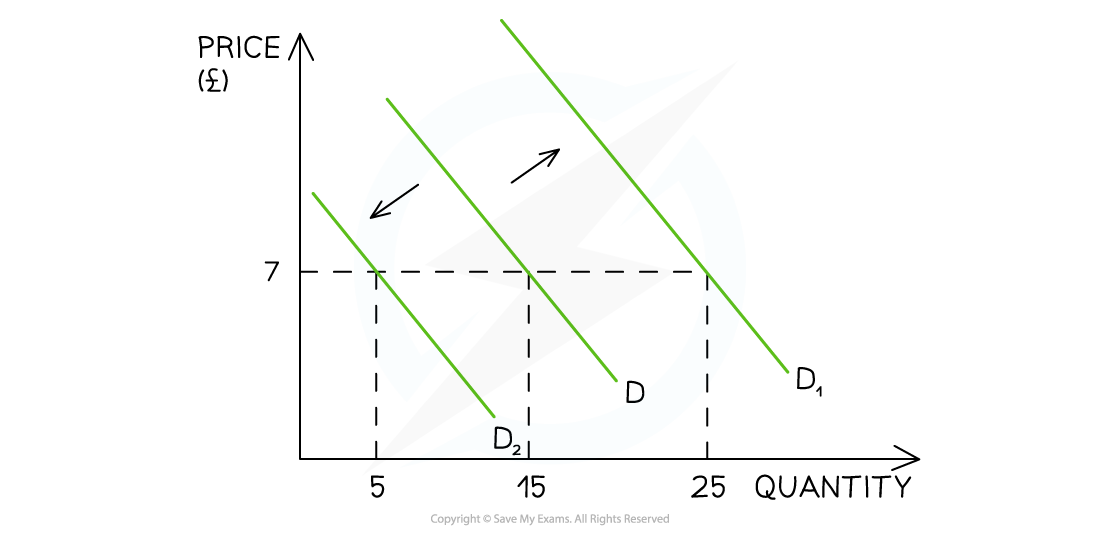
For example, if a firm increases their Instagram advertising, there will be an increase in demand as more consumers become aware of the product
This is a shift in demand from D to D1
The price remains unchanged at £7 but the demand has increased from 15 to 25 units
Illustrating changes to the conditions of demand
Illustrating changes to the conditions of demand
1. A change in real income
Real Income determines how many goods/services can be enjoyed by consumers
In most cases, there is a direct relationship between income and demand for goods and services
If income increases
Demand increases and shifts right (D→D1)
If income decreases
Demand decreases and shifts left (D→D2)
2. Change in consumer tastes and preferences
If goods and services become more fashionable, then demand for them increases
There is a direct relationship between changes in consumer preferences and demand
If preference for a product increase
Demand increases and shifts right (D→D1)
If preference for a product decrease
Demand decreases and shifts left (D→D2)
3. Improved advertising and branding
If more money is spent on advertising or branding, then demand for goods and services will increase as more consumers become aware of the product
There is a direct relationship between branding or advertising and demand
If advertising or brand awareness of a product increases
Demand increases and shifts right (D→D1)
If advertising or brand awareness of a product decreases
Demand decreases and shifts left (D→D2)
4. Changes in the prices of substitute goods
Changes in the price of substitute goods will influence the demand for a product/service
There is a direct relationship between the price of good A and demand for good B
For example, the price of a Sony 60" TV increases so the demand for LG 60" TV increases
If the price of good A increases
Demand for good B increases and shifts right (D→D1)
If the price of good A decreases
Demand for good B decreases and shifts left (D→D2)
5. Changes in the prices of complementary goods
Changes in the price of complementary goods will influence the demand for a product or service
There is an inverse relationship between the price of good A and demand for good B
For example, the price of printer ink increases so the demand for ink printers decreases
If the price of good A increases
Demand for good B decreases and shifts left (D→D2)
If the price of good A decreases
Demand for good B increases and shifts right (D→D1)
6. Changes in population size or distribution
If the population size of a country changes over time, then demand for goods and services will also change
There is a direct relationship between the changes in population size and demand
Demand will also change if there is a change to the age distribution in a country, as different ages demand different goods and services
For example, an ageing population will buy more hearing aids
If the population increases
Demand increases and shifts right (D→D1)
If the population decreases
Demand decreases and shifts left (D→D2)