StudyDeck

Conditions of Demand

Exam code: 2281
Written by: Ashika|Reviewed by: Caroline Carroll|Updated 2 July 2026

Shifts of the Demand Curve

Shifts of the Demand Curve

  • There are numerous factors that will change the demand for a good/service, irrespective of the price level

    • Collectively, these factors are called the conditions of demand

  • Changes to each of the conditions of demand, shift the entire demand curve (as opposed to a movement along the demand curve)
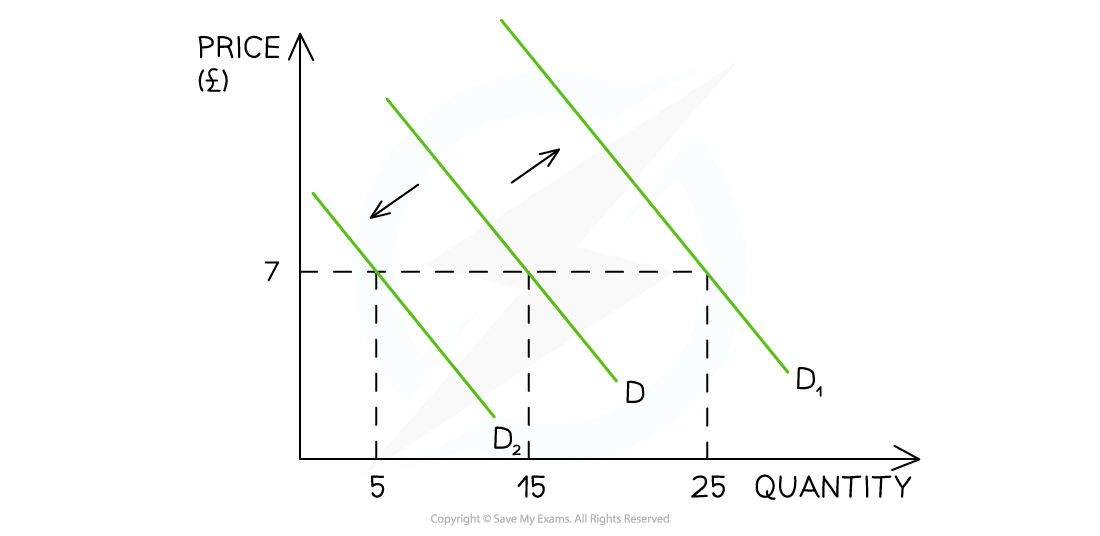
Graph showing shifting demand curves (D, D1, D2) for quantity and price in £. Arrows indicate leftward and rightward shifts. D intersecting at price 7 and quantity 15.
A graph that shows how changes to any of the conditions of demand shifts the entire demand curve left or right, irrespective of the price level
  • For example, if a firm increases their Instagram advertising, there will be an increase in demand as more consumers become aware of the product

    • This is a shift in demand from D to D1

      • The price remains unchanged at £7 but the demand has increased from 15 to 25 units

How Each of the Conditions of Demand Shifts the Entire Demand Curve

A Change in Real Income

  • Real Income determines how many goods/services can be enjoyed by consumers

  • There is a direct relationship between income and demand for goods and services 

  • Income increases

    • D Increases

      • Shifts right

      • (D→D1)

  • Income decreases

    • D Decreases

      • Shifts left

      • (D→D2)

A Change in Tastes and Fashion

  • If goods and services become more fashionable, then demand for them increases

  • There is a direct relationship between changes in taste/fashion and demand

  • Good becomes more fashionable

    • D Increases

      • Shifts right

      • (D→D1)

  • Good becomes less fashionable

    • D Decreases

      • Shifts left

      • (D→D2)

Improved Advertising and Branding

  • If more money is spent on advertising or branding, then demand for goods and services will increase as more consumers become aware of the product

  • There is a direct relationship between branding or advertising and demand

  • Advertising increases

    • D Increases

      • Shifts Right

      • (D→D1)

  • Advertising decreases

    • D Decreases

      • Shifts left

      • (D→D2)

Changes in the Prices of Substitute Goods

  • Changes in the price of substitute goods will influence the demand for a product/service

  • There is a direct relationship between the price of good A and demand for good B

  • For example, the price of a Sony 60" TV increases so the demand for LG 60" TV increases

  • Price of Good A increases

    • D for Good B increases

      • Shifts Right

      • (D→D1)

  • Price of Good A decreases

    • D for Good B decreases

      • Shifts left

      • (D→D2)

Changes in the Prices of Complementary goods

  • Changes in the price of complementary goods will influence the demand for a product/service

  • There is an inverse relationship between the price of good A and demand for good B

  • E.g. The price of printer ink increases so the demand for ink printers decreases

  • Price of Good A increases

    • D for Good B decreases

      • Shifts left

      • (D→D2)

  • Price of Good A decreases

    • D for Good B increases

      • Shifts right

      • (D→D1)

Changes in Population Size or Distribution

  • If the population size of a country changes over time, then the demand for goods/services will also change

  • There is a direct relationship between the changes in population size and demand

  • Demand will also change if there is a change to the age distribution in a country, as different ages demand different goods and services E.g. An ageing population will buy more hearing aids

  • Population Increases

    • D Increases
      Shifts Right
      (D→D1)

  • Population Decreases

    • D Decreases
      Shifts Left
      (D→D2)