Calculation & Determinants of PED
Introducing price elasticity of demand
Introducing price elasticity of demand
The law of demand states that when there is an increase in price, there will be a fall in quantity demanded
Economists are interested by how much the quantity demanded will fall
Price elasticity of demand reveals how responsive the change in quantity demanded is to a change in price
The responsiveness is different for different types of products
Calculation of PED
PED can be calculated using the following formula:
To calculate a % change, use the following formula:
Drawing and interpreting PED values
Drawing and interpreting PED values
The results of the price elasticity of demand calculation tell us how responsive consumers are to a change in price
1. Price elastic demand
The value of PED: 1 → ∞
The percentage change in quantity demanded is more than proportional to the percentage change in price

Consumers are very responsive to price changes
For example, a small price cut on airline tickets in Malaysia can lead to a large rise in bookings
2. Price inelastic demand
The value of PED: 0 → 1
The percentage change in quantity demanded is less than proportional to the percentage change in price

Consumers are relatively unresponsive to price changes
They may consider the product to be a necessity
For example, cigarette sales in Indonesia fall only slightly when prices rise – demand is inelastic
3. Perfectly elastic demand
The value of PED: ∞
The quantity demanded will fall to zero with any percentage change in price (highly theoretical elasticity)

Buyers will only purchase at one price, and any change causes demand to drop to zero
For example, on global stock markets, traders may only buy a share at a specific price, not higher
4. Perfectly inelastic demand
The value of PED: 0
The quantity demanded is completely unresponsive to a change in price (very theoretical value)

For example, a patient needing life-saving insulin in India will buy it regardless of price
5. Unitary elasticity
The value of PED: 1
The percentage change in quantity demanded is exactly equal to the percentage change in price

A 5% rise in the price of a basic mobile plan in Egypt causes a 5% drop in subscriptions
The determinants of PED
The determinants of PED
Some products are more responsive to changes in prices than other products
The factors that determine responsiveness are called the determinants of PED and include
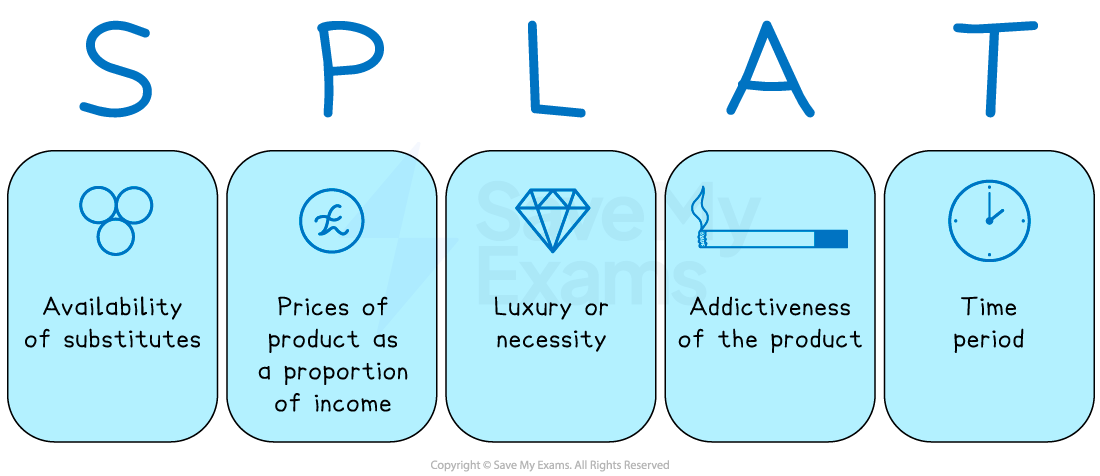
S – Availability of substitutes
Good availability of substitutes results in a higher value of PED (relatively elastic)
P – Price of product as a proportion of income
The lower the proportion of income the price represents, the lower the PED value will be
Consumers are less responsive to price changes on cheap products (relatively inelastic)
L – Luxury or necessity
Luxury goods are more elastic because they are not essential, while necessities are more inelastic because consumers have no choice but to buy them.
A - Addictiveness of the product
Addictiveness turns products into necessities, resulting in a low value of PED (relatively inelastic)
T – Time period
In the short term, consumers are less responsive to price increases, resulting in a low value of PED (relatively inelastic)
Over a longer period of time, consumers may feel the price increase more and will then look for substitutes, resulting in a higher value of PED (relatively elastic)