Demand, Price & Quantity
Introduction to Demand
Introduction to Demand
Demand is the amount of a good/service that a consumer is willing and able to purchase at a given price in a given time period
If a consumer is willing to purchase a good, but cannot afford to, it is not effective demand
A demand curve is a graphical representation of the price and quantity demanded (QD) by consumers
If data were plotted, it would be an actual curve. Economists, however, use straight lines so as to make analysis easier
Individual and market demand
Market demand is the combination of all the individual demand for a good/service
It is calculated by adding up the individual demand at each price level
The Monthly Market Demand for Newspapers in a Small Village
Customer 1 | Customer 2 | Customer 3 | Customer 4 | Market Demand |
|---|---|---|---|---|
30 | 15 | 4 | 4 | 53 |
Individual and market demand can also be represented graphically
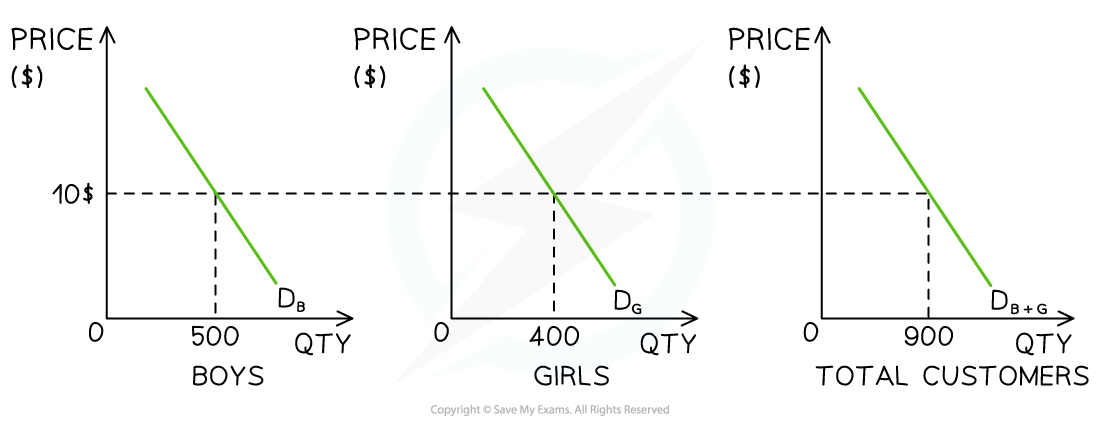
Market demand for children's swimwear in July is the combination of boys and girls demand
Diagram analysis
A shop sells both boys and girls swimwear
In July, at a price of $10, the demand for boys swimwear is 500 units and girls is 400 units
At a price of $10, the shops market demand during July is 900 units
Movements Along a Demand Curve
Movements Along a Demand Curve
If price is the only factor that changes (ceteris paribus), there will be a change in the quantity demanded (QD)
This change is shown by a movement along the demand curve
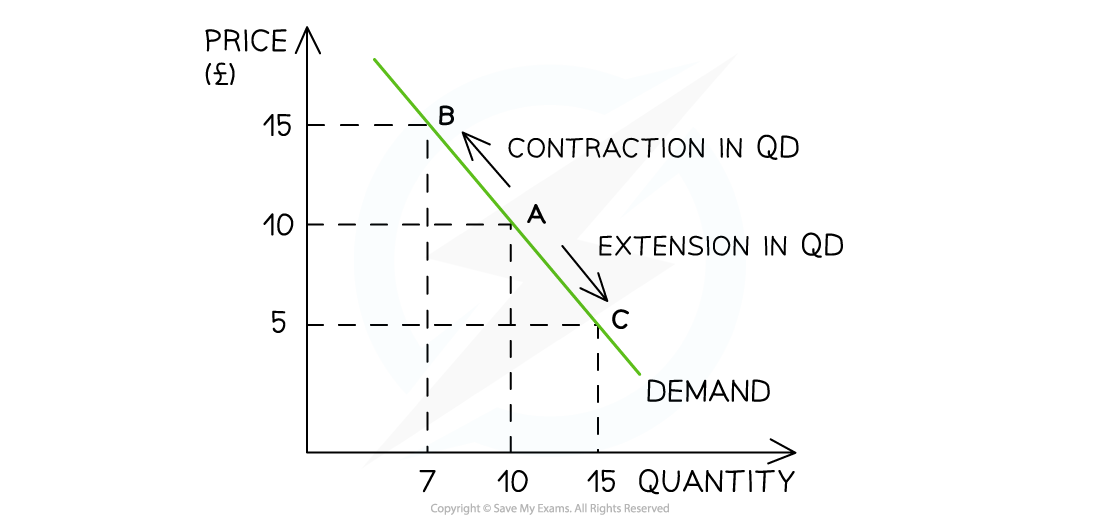
Diagram analysis
An increase in price from £10 to £15 leads to a movement up the demand curve from point A to B
Due to the increase in price, the QD has fallen from 10 to 7 units
This movement is called a contraction in QD
A decrease in price from £10 to £5 leads to a movement down the demand curve from point A to point C
Due to the decrease in price, the QD has increased from 10 to 15 units
This movement is called an extension in QD
The law of demand captures this fundamental relationship between price and QD
It states that there is an inverse relationship between price and QD
When the price rises the QD falls
When prices fall the QD rises