Break-even Charts
An Introduction to Break-even
An introduction to break-even
Break-even analysis is a financial tool used to determine the number of units a business must sell to reach the point where the business revenue equals its expenses (no profit nor loss)
It helps businesses understand the minimum level of sales or output they need to achieve in order to cover all costs
This helps business managers to make informed decisions about pricing and production volumes
The break-even point is the number of units that need to be sold for total costs to equal the sales revenue
The elements of a break-even analysis
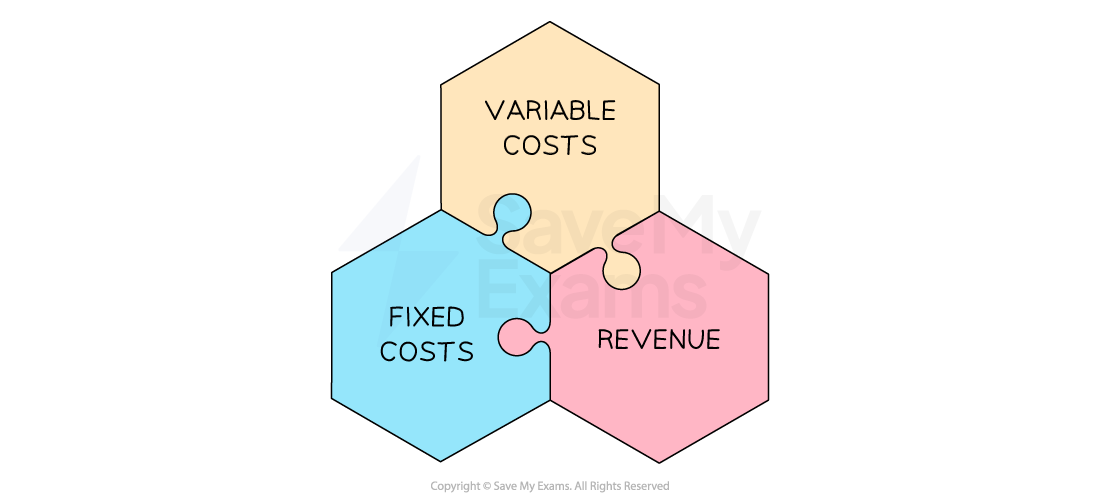
Fixed costs are costs that do not change regardless of the level of production or sales
E.g. rent, salaries and insurance
Variable costs are costs that vary with the level of production or sales
E.g. raw materials, direct labour costs, packaging and shipping costs
Sales revenue is the money gained from selling products/service and is calculated as follows:
Sales revenue = number of items sold x selling price
Constructing a Break-even Chart
Constructing a break-even chart
Break-even charts are graphs which identify the number of units a business must sell in order to break-even
The break-even point occurs when the total cost = total revenue
The break even point is the number of units that have to be sold for the total cost to equal the total revenue
In order to construct a break-even chart, the business needs to know the estimated fixed costs, variable costs and sales revenue
Interpreting a Break-even Chart
Interpreting a break-even chart
A break even chart is a visual representation of the break-even point and is used to identify several key metrics
The break-even point
The margin of safety
The expected profit or loss
A break-even chart
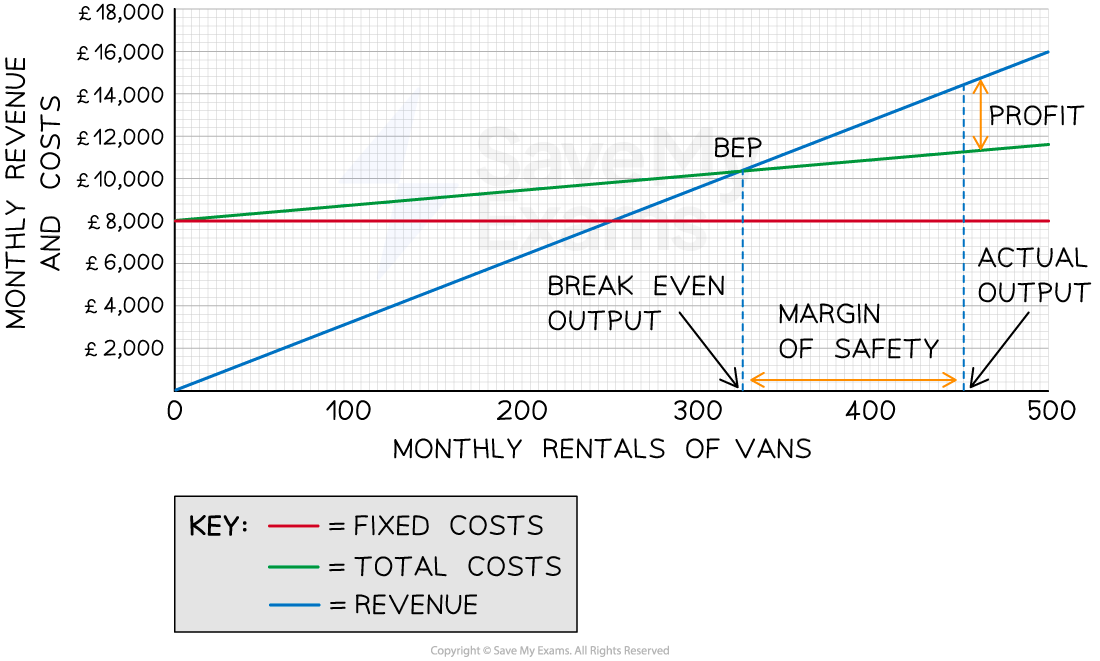
Diagram analysis
Fixed costs:
Fixed costs do not change as output increases
A2B's fixed costs are £8,000 and these do not change whether the business produces 0 units or 500 units
Total costs:
Total costs are made up of fixed and variable costs
At 0 units of output, they are made up exclusively of fixed costs
At 500 units the total variable costs equate to £11,800
This line slopes upwards because total variable costs increase as output increases
Sales revenue:
The revenue line also slopes upwards
At 0 units of output, the revenue is £0
At 500 units the total revenue equates to £11,800
Revenue will increase with the output
The line will slope more steeply than the total costs and will cross the total costs line at some point
Break-even point:
The point at which the total costs and the revenue lines cross is the break even point
The break even level of output for A2B is 324 units
Margin of safety:
The margin of safety can be identified as the difference on the x-axis between the actual level of output (in this case 450 units) and the break even point (300 units). The margin of safety is 150 units
Profit:
The profit made at a specific level of output can be identified as the space between the revenue and total costs lines
In this instance, the profit made at 450 units of output is £14,400 - £11,250 = £3,150