Break-Even Analysis
The concept of break-even
The concept of break-even
The break-even point is the number of units that need to be sold for total costs to equal the sales revenue
It helps businesses understand the minimum level of sales or output they need to achieve in order to cover all costs
This helps business managers to make informed decisions about pricing and production volumes
Elements of a break-even analysis
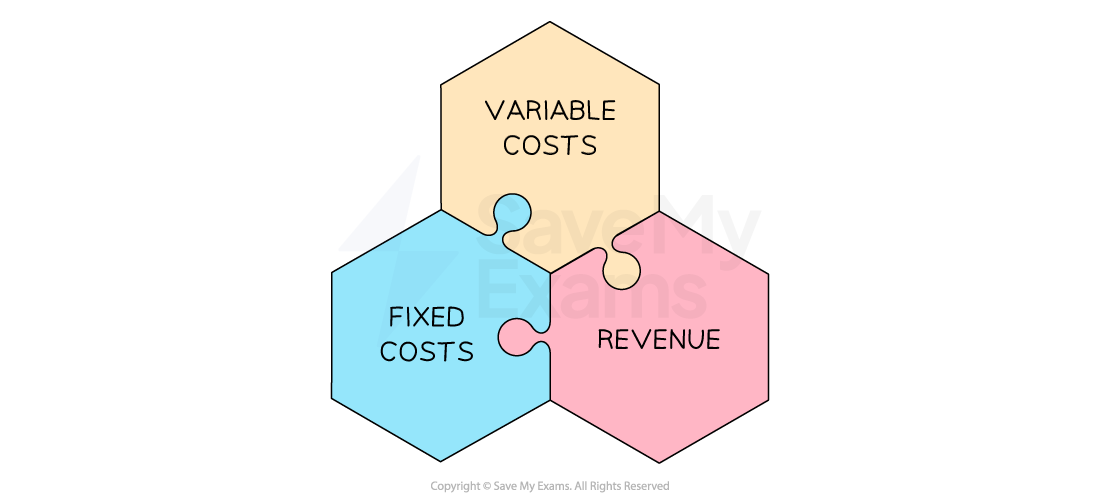
Fixed costs do not change, regardless of the level of production or sales
E.g. rent, salaries and insurance
Variable costs vary with the level of production or sales
E.g. raw materials, direct labour costs, packaging and shipping costs
Sales revenue is money gained from selling products, calculated using the formula
The break-even chart
The break-even chart
Break-even charts show the number of units a business must sell in order to break-even
In order to construct a break-even chart, the business needs to know the estimated fixed costs, variable costs and sales revenue
Calculating break-even output
Calculating break-even output
The break-even point can be calculated using the formula
The margin of safety
The margin of safety
The margin of safety is the amount by which the number of units sold is greater than the break-even point
The margin of safety provides useful information to a firm on how many sales they could lose before they start making a loss
The margin of safety can be calculated using the following formula:
Businesses want their margin of safety to be as large as possible
This means that if demand for their products drops unexpectedly, the business will continue to make a profit