Identifying & Classifying Costs
Introduction to costs
Introduction to costs
Businesses incur a range of costs
Examples include purchasing raw materials, paying staff salaries and wages and paying utility bills such as electricity
These costs can be classified as follows:
Fixed costs
Variable costs
Total costs
Average costs
Fixed costs
Fixed costs
Fixed costs (FC) are costs that do not change as the level of output changes
These have to be paid whether the output is zero or 5000 units
Examples include rent, management salaries, insurance and bank loan repayments
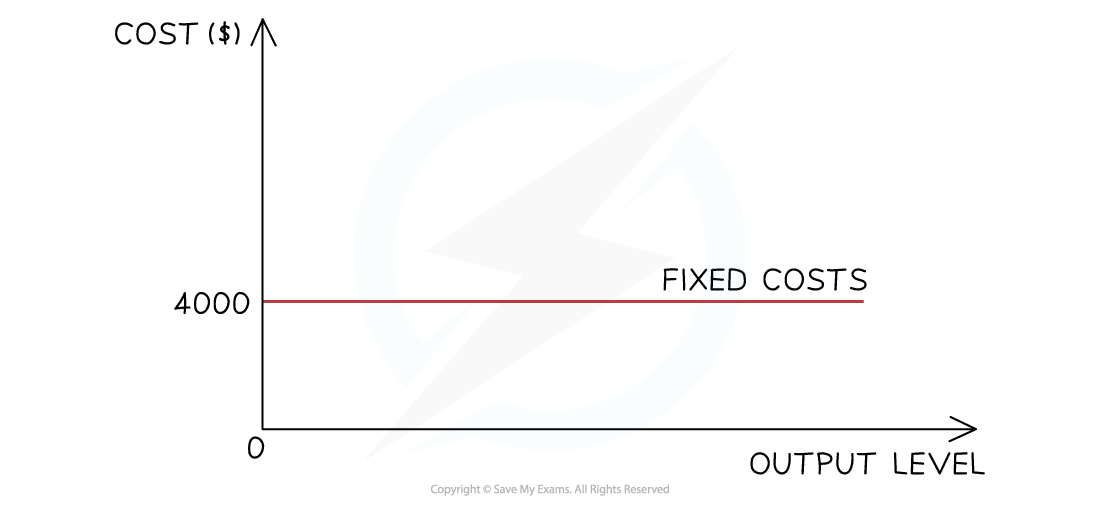
Fixed costs can be plotted on a graph as a horizontal line
The fixed costs for this firm are $4,000 at all levels of output
Variable costs
Variable costs
Variable costs (VC) are costs that are directly linked to output
They increase as output increases and vice versa
Examples include raw material costs and wages of workers directly involved in production

Variable costs are plotted on a graph as an upwards sloping line, starting at 0
Total costs
Total costs
The total cost is the sum of the variable and fixed costs
Total costs are calculated using the formula

The total costs cannot be 0, as all firms have some level of fixed costs
Total costs are plotted on a graph as an upwards sloping line, parallel to the variable costs, starting at the level of fixed costs
Average costs
Average costs
The average cost is the typical cost of producing one unit of output
It is sometimes called the unit cost
As a firm grows, it is able to increase its scale of output generating efficiencies that lower its average total costs (AC) of production
These efficiencies are called economies of scale
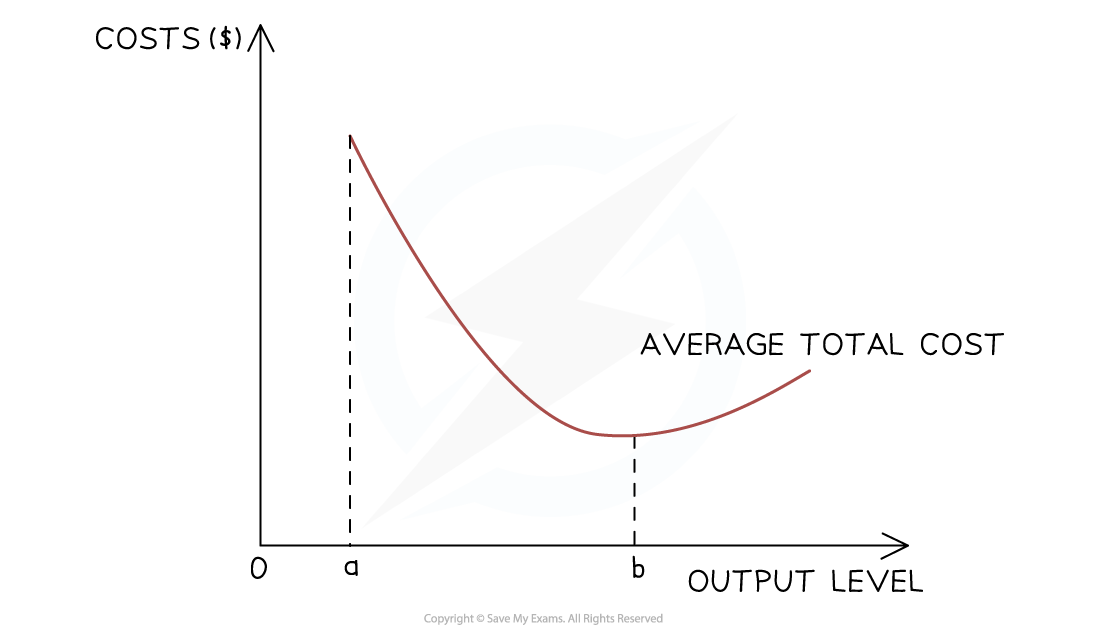
As a firm continues increasing its scale of output, it will reach a point where its average total costs (AC) start to increase
These inefficiencies are called diseconomies of scale
Using cost data to make decisions
Using cost data to make decisions
Businesses can use cost data to make data-driven business decisions
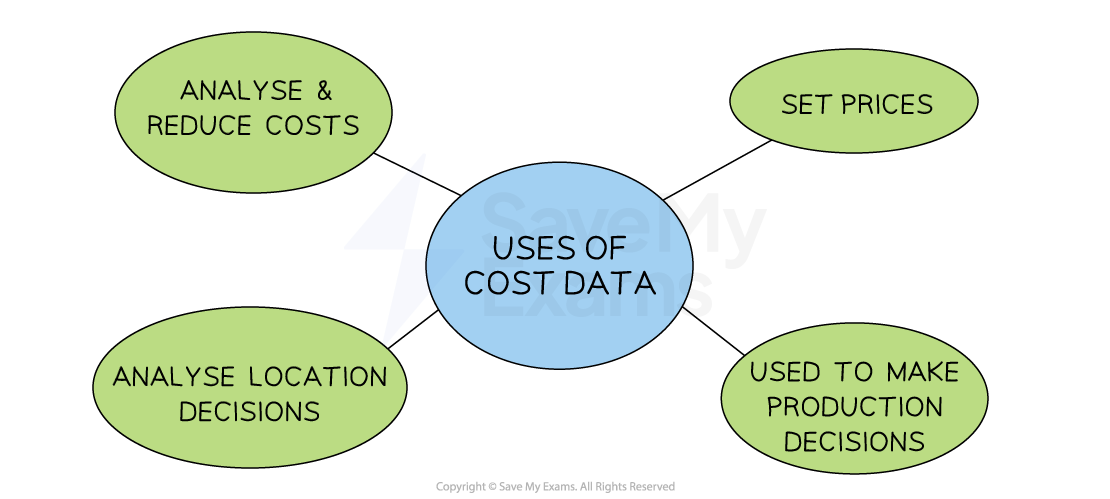
1. To reduce costs
Accurate cost data helps a business see if costs are too high
Reducing costs is a key way to increase profit
Fixed costs can be reduced by moving to cheaper premises, lowering staff salaries, cutting promotional spending or using cheaper utility suppliers
Variable costs can be lowered by buying cheaper or bulk raw materials, or outsourcing delivery
Businesses must consider how cost-cutting affects customer service, product quality and delivery speed
Paying lower wages may lead to less experienced or skilled staff
Cheaper materials might reduce product quality
2. To set prices
Costs are important when deciding the selling price.
They directly affect how much profit a business makes.
For example, if a cake costs $3 to make and the business wants to make a $1 profit on each cake, it must sell them for $4
3. To make production decisions
If production costs are higher than revenue, the business will make a loss
The business must decide whether to keep or stop making it
This depends on factors including
Whether it’s a new product, with sales likely to rise
Whether fixed costs will need to be paid, even if production stops
4. To make location decisions
Renting or buying premises is a major cost
Some areas are cheaper than others
Businesses must compare these savings to other factors like transport, closeness to customers and available workers