Distance-Time Graphs
Distance-Time Graphs
Distance-Time Graphs
A distance-time graph shows how the distance of an object moving in a straight line (from a starting position) varies over time:
Distance-time graph
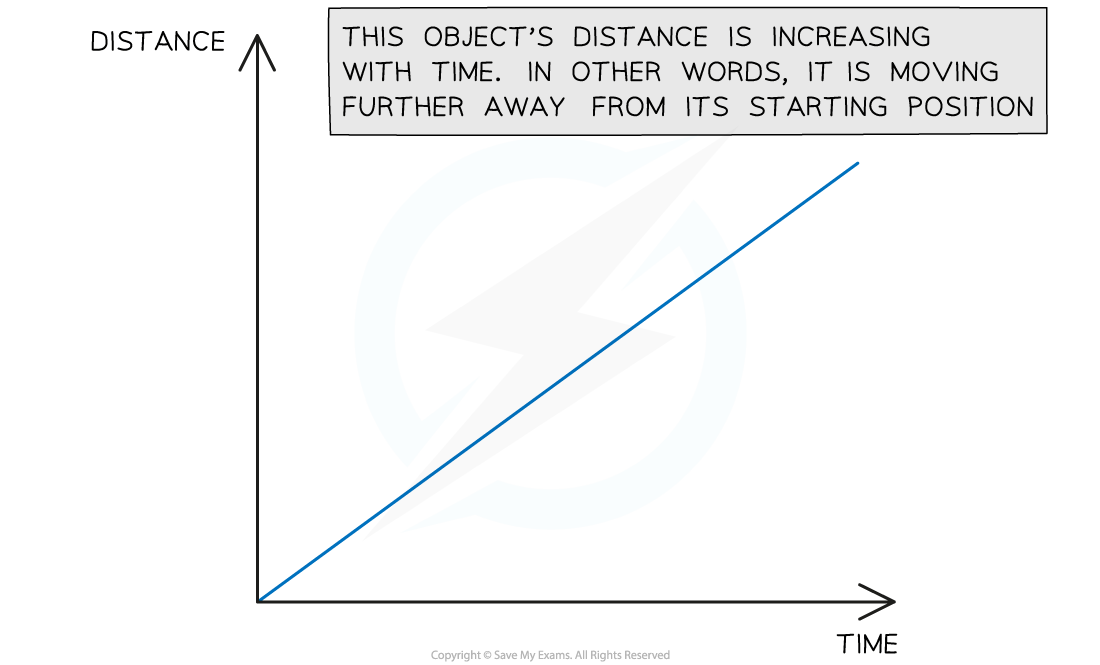
This graph shows a moving object moving further away from its origin
Constant Speed on a Distance-Time Graph
Distance-time graphs also show the following information:
If the object is moving at a constant speed
How large or small the speed is
A straight line represents constant speed
The slope of the straight line represents the magnitude of the speed:
A very steep slope means the object is moving at a large speed
A shallow slope means the object is moving at a small speed
A flat, horizontal line means the object is stationary (not moving)
Faster and slower speed on a distance-time graph
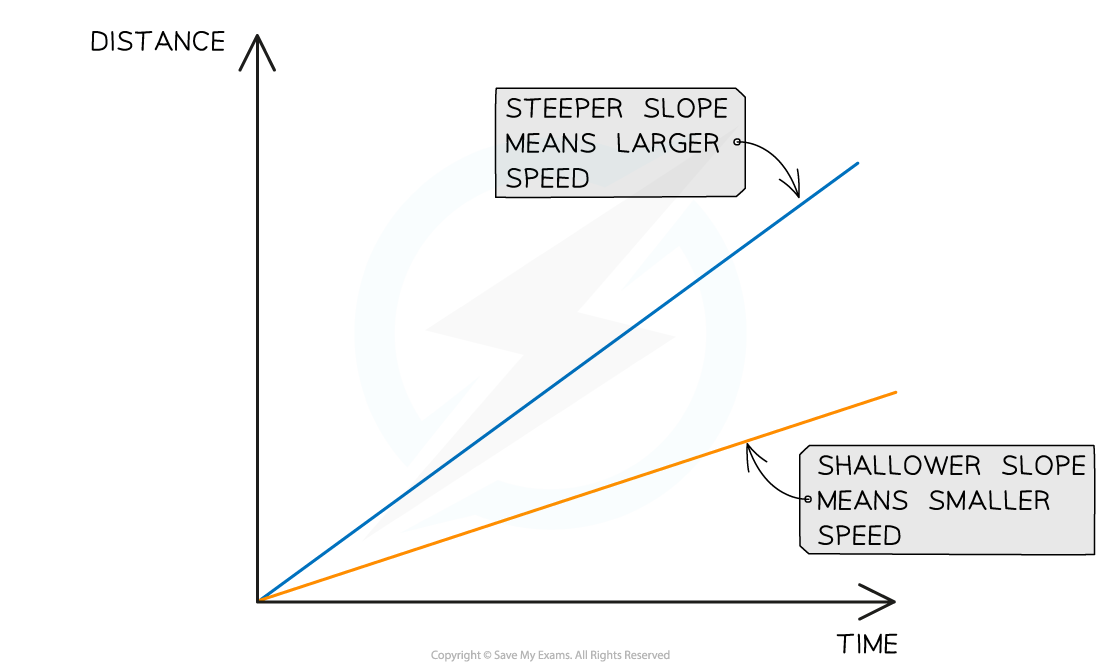
This graph shows how the slope of a line is used to interpret the speed of moving objects. Both of these objects are moving with a constant speed, because the lines are straight.
Changing Speed on a Distance-Time Graph
Objects might be moving at a changing speed
This is represented by a curve
In this case, the slope of the line will be changing
If the slope is increasing, the speed is increasing (accelerating)
If the slope is decreasing, the speed is decreasing (decelerating)
The image below shows two different objects moving with changing speeds
Acceleration and deceleration on a distance-time graph
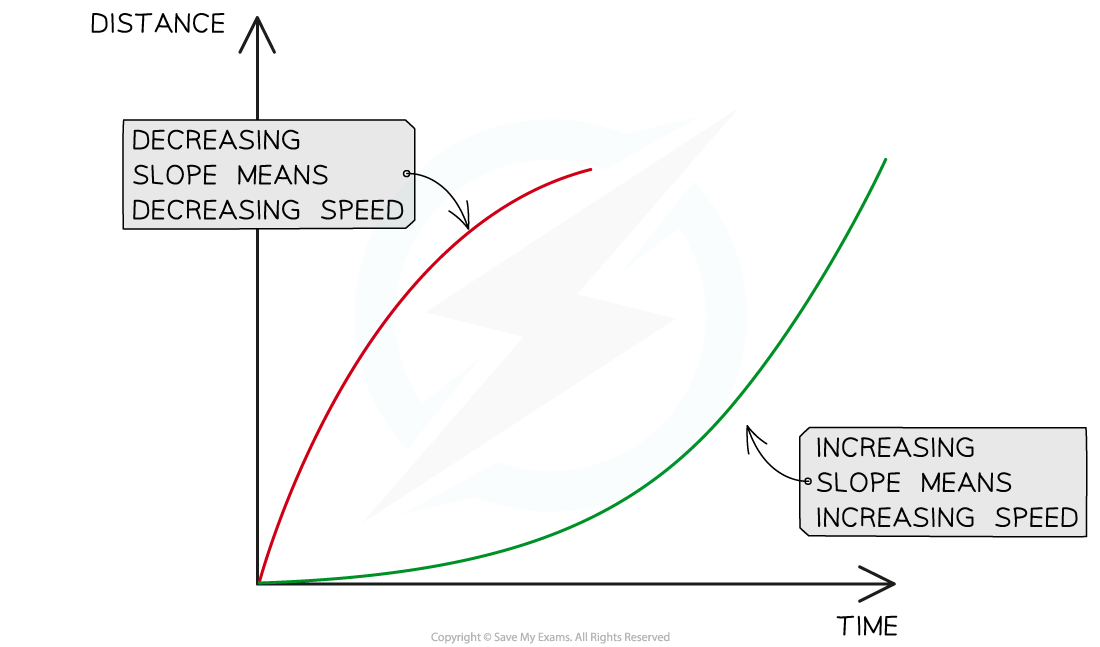
Changing speeds are represented by changing slopes. The red line represents an object slowing down and the green line represents an object speeding up.
Using Distance-Time Graphsvideo
Using Distance-Time Graphs
The speed of a moving object can be calculated from the gradient of the line on a distance-time graph:
Gradient of a distance-time graph
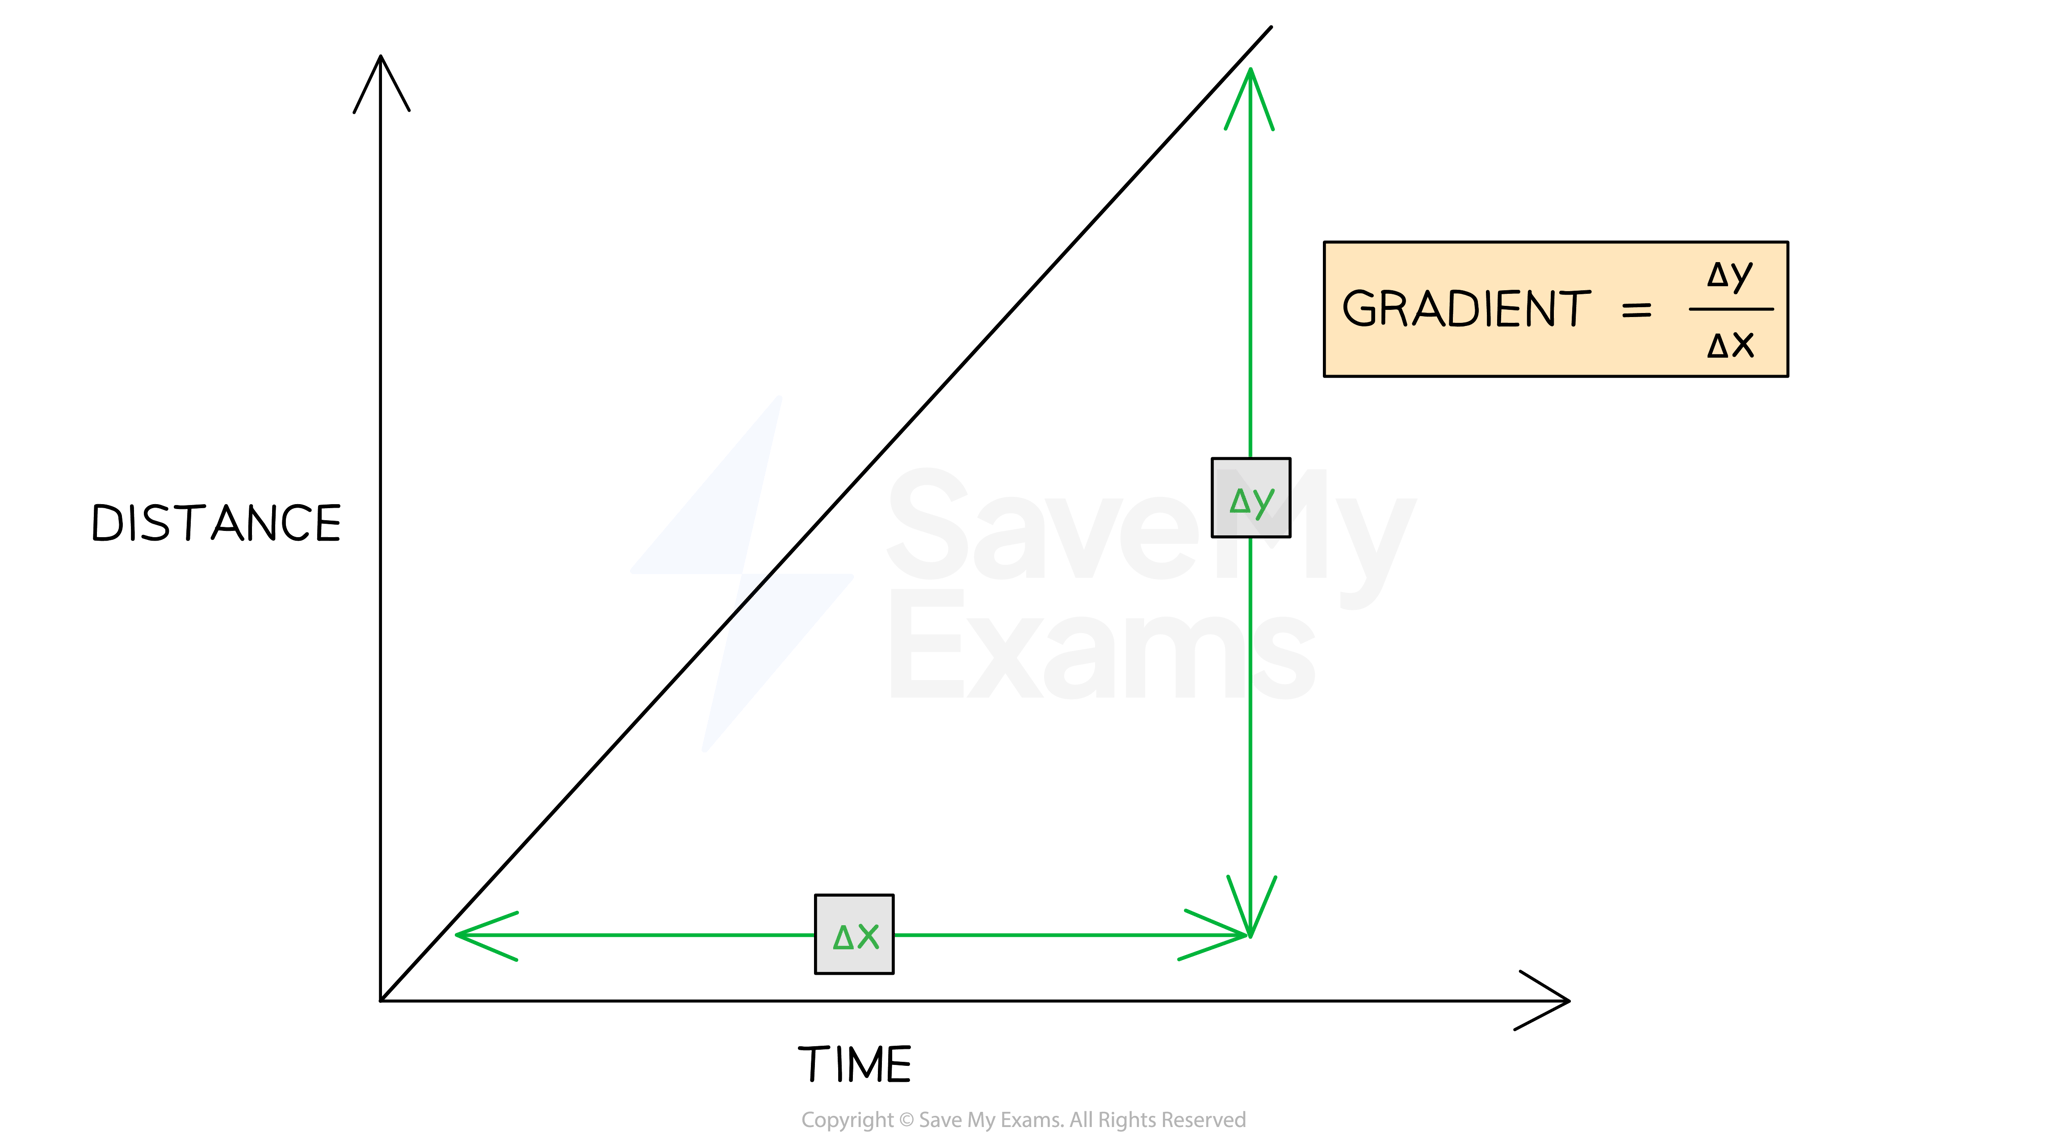
The speed of an object can be found by calculating the gradient of a distance-time graph
is the change in y (distance) values
is the change in x (time) values