Conservation of Energy
Conservation of Energyvideo
Conservation of Energy
The principle of conservation of energy states that:
Energy cannot be created or destroyed, it can only be transferred from one store to another
This means that for a closed system, the total amount of energy is constant
The total amount of energy transferred into the system must be equal to the total amount of energy transferred away from the system
Therefore, energy cannot be ‘lost’, but it can be transferred to the surroundings
Energy can be dissipated (spread out) to the surroundings by heating and radiation
Dissipated energy transfers are often not useful, in which case they can be described as wasted energy
Energy Flow Diagrams
Energy stores and transfers can be represented using a flow diagram
This shows both the stores and the transfers taking place within a system
Energy Transfers in a Nuclear Power Plant
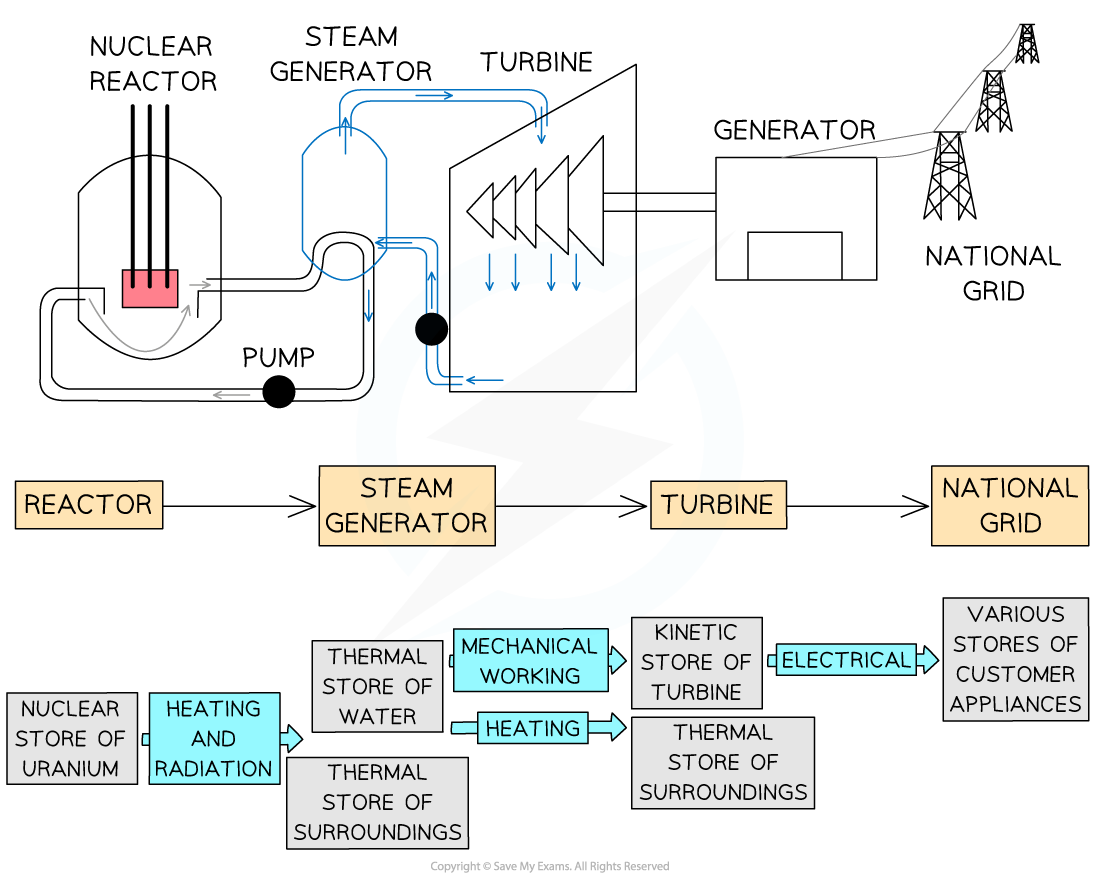
Energy flow diagram showing energy stores and transfers in a nuclear power plant. Note the colour difference of the labels (stores) and the arrows (transfer pathways)
Sankey Diagrams
Sankey diagrams can be used to represent energy transfers
Sankey diagrams are characterised by the splitting arrows that show the proportions of the energy transfers taking place
The different parts of the arrow in a Sankey diagram represent the different energy transfers:
The left-hand side of the arrow (the flat end) represents the energy transferred into the system
The straight arrow pointing to the right represents the energy that ends up in the desired store; this is the useful energy output
The arrows that bend away represent the wasted energy
Sankey Diagram of Energy In and Energy Out
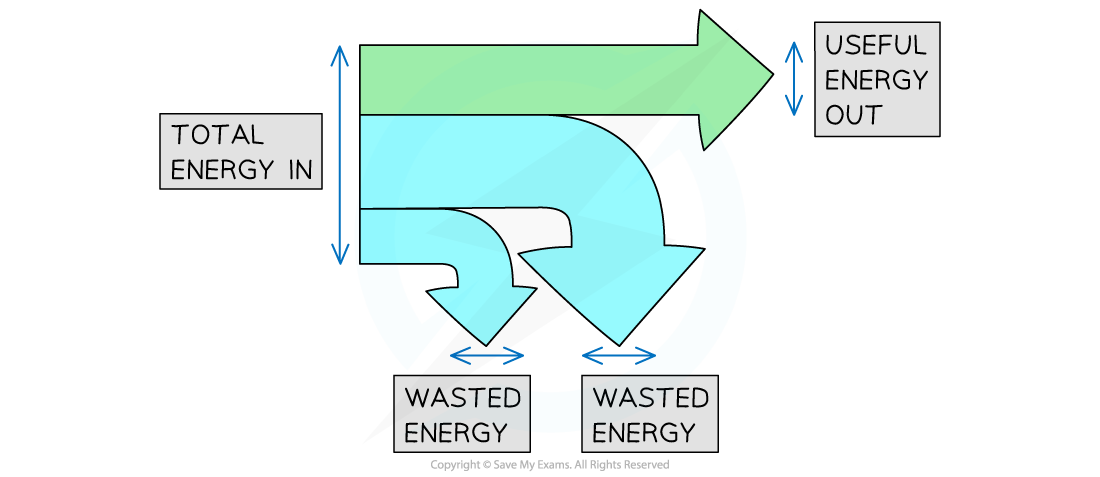
Total energy in, wasted energy and useful energy out shown on a Sankey diagram
The width of each arrow is proportional to the amount of energy being transferred
As a result of the conversation of energy:
Total energy in = Useful energy out + Wasted energy
A Sankey diagram for a modern efficient light bulb will look very different from that for an old filament light bulb
A more efficient light bulb has less wasted energy
This is shown by the smaller arrow downwards representing the heat energy
Sankey Diagrams showing Different Efficiencies
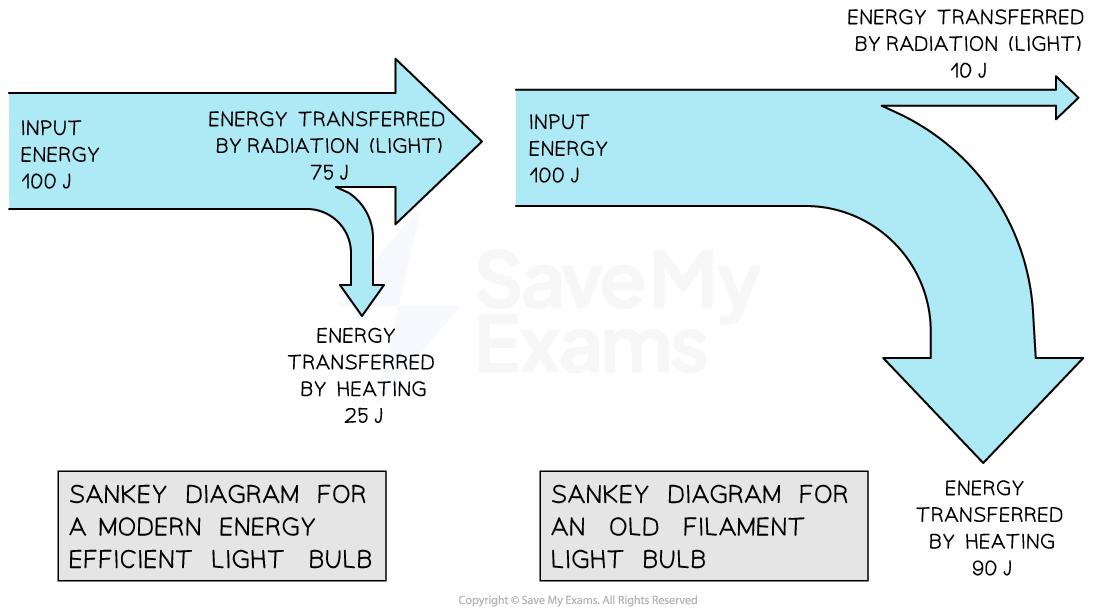
Sankey diagram for modern vs. old filament light bulb