Speed-Time Graphs
Speed-Time Graphsvideo
Speed-Time Graphs
A speed-time graph shows how the speed of a moving object varies with time
The red line represents an object with increasing speed
The green line represents an object with decreasing speed
Increasing and decreasing speed
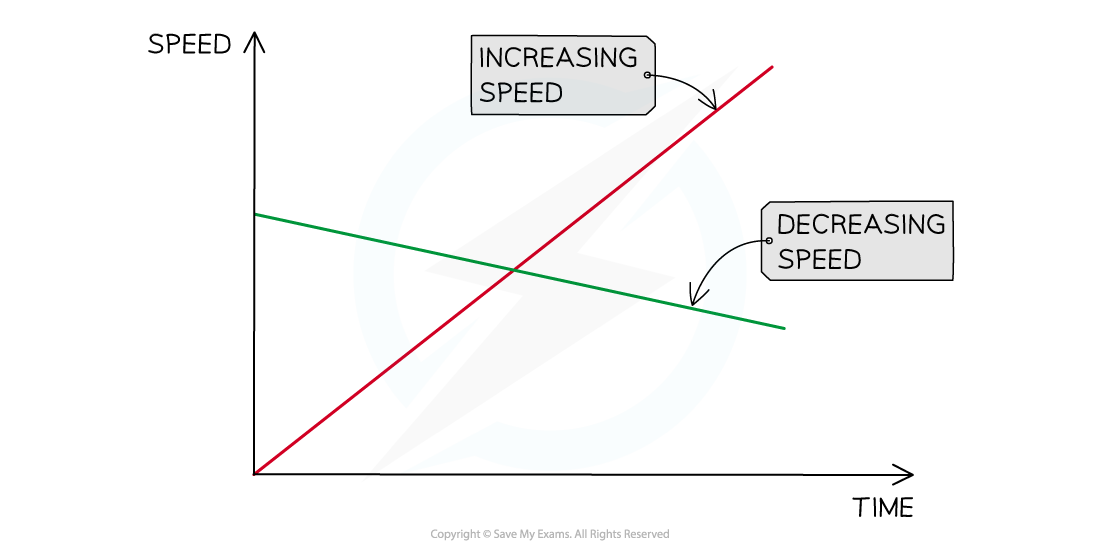
Increasing and decreasing speed represented on a speed-time graph
Acceleration on a Speed-Time Graph
Speed-time graphs also show the following information:
If the object is moving with a constant acceleration or deceleration
The magnitude of the acceleration or deceleration
A straight line represents constant acceleration
The slope of the line represents the magnitude of acceleration
A steep slope means large acceleration (or deceleration) - i.e. the object's speed changes very quickly
A gentle slope means small acceleration (or deceleration) - i.e. the object's speed changes very gradually
A flat line means the acceleration is zero - i.e. the object is moving with a constant speed
Acceleration, deceleration and constant speed
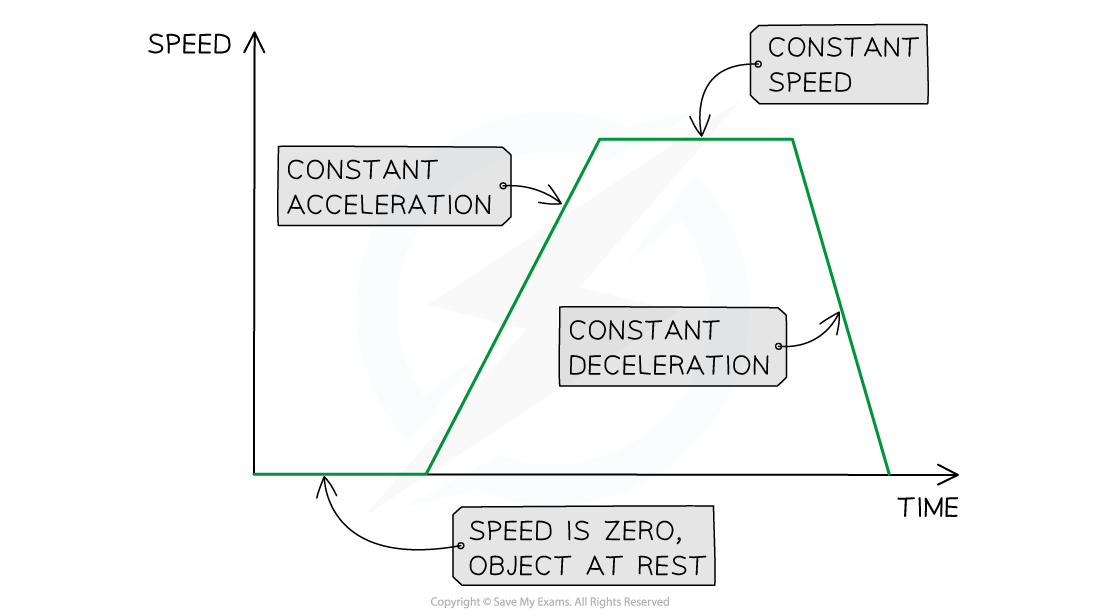
This image shows how to interpret the slope of a speed-time graph
Using Speed-Time Graphs
Using Speed-Time Graphs
The distance travelled by an object can be found by determining the area beneath the graph
Area under a velocity-time graph
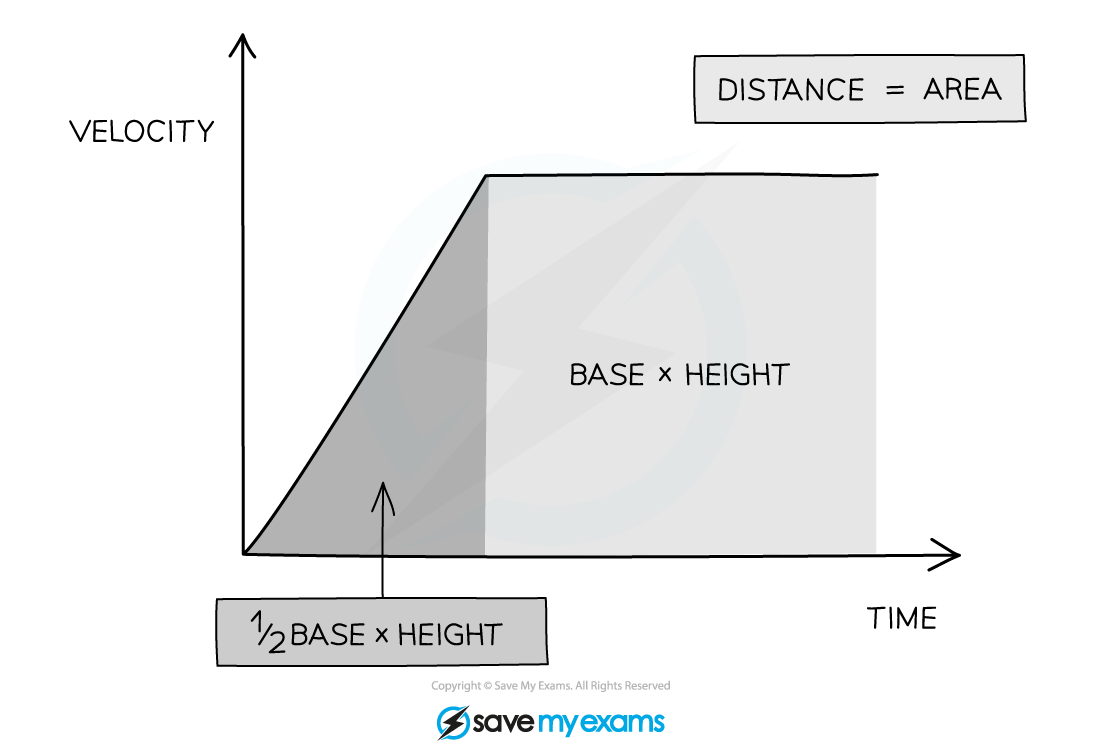
The distance travelled can be found from the area beneath the graph
If the area beneath the graph forms a triangle (the object is accelerating or decelerating) then the area can be determined using the formula:
If the area beneath the graph is a rectangle (constant velocity) then the area can be determined using the formula: